
REV Group, Inc. (REVG): Price and Financial Metrics
REVG Price/Volume Stats
| Current price | $28.47 | 52-week high | $28.68 |
| Prev. close | $27.41 | 52-week low | $12.51 |
| Day low | $27.78 | Volume | 613,949 |
| Day high | $28.68 | Avg. volume | 859,303 |
| 50-day MA | $26.00 | Dividend yield | 0.73% |
| 200-day MA | $20.43 | Market Cap | 1.48B |
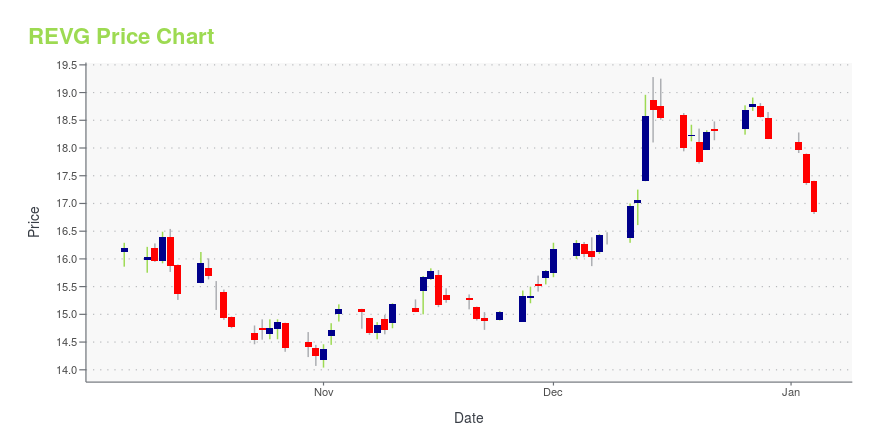
REVG Stock Price Chart Interactive Chart >
REV Group, Inc. (REVG) Company Bio
REV Group, Inc. designs, manufactures, and distributes specialty vehicles in the United States, Canada, Europe, Africa, the Middle East, and internationally. It operates through three segments: Fire & Emergency, Commercial, and Recreation. The company is based in Milwaukee, Wisconsin.
Latest REVG News From Around the Web
Below are the latest news stories about REV GROUP INC that investors may wish to consider to help them evaluate REVG as an investment opportunity.
REV Group Inc's Dividend AnalysisREV Group Inc (NYSE:REVG) recently announced a dividend of $0.05 per share, payable on 2024-01-12, with the ex-dividend date set for 2023-12-22. As investors look forward to this upcoming payment, the spotlight also shines on the company's dividend history, yield, and growth rates. Using the data from GuruFocus, let's look into REV Group Inc's dividend performance and assess its sustainability. |
Best EV Stocks 2024: 3 Names to Add to Your Must-Buy ListExplore the top EV stocks for 2024, featuring the latest market trends and investment opportunities in the electric vehicle industry. |
REV Group, Inc. (NYSE:REVG) Q4 2023 Earnings Call TranscriptREV Group, Inc. (NYSE:REVG) Q4 2023 Earnings Call Transcript December 13, 2023 REV Group, Inc. beats earnings expectations. Reported EPS is $0.53, expectations were $0.34. Operator: Greetings, and welcome to the REV Group Fourth Quarter 2023 Earnings Conference Call. At this time, all participants are in a listen-only mode. A brief question-and-answer session will follow […] |
REVG Stock Earnings: REV Group Beats EPS, Beats Revenue for Q4 2023REVG stock results show that REV Group beat analyst estimates for earnings per share and beat on revenue for the fourth quarter of 2023. |
REV Group (REVG) Q4 Earnings: Taking a Look at Key Metrics Versus EstimatesAlthough the revenue and EPS for REV Group (REVG) give a sense of how its business performed in the quarter ended October 2023, it might be worth considering how some key metrics compare with Wall Street estimates and the year-ago numbers. |
REVG Price Returns
| 1-mo | 14.29% |
| 3-mo | 34.31% |
| 6-mo | 87.38% |
| 1-year | 169.93% |
| 3-year | 136.62% |
| 5-year | 145.53% |
| YTD | 85.93% |
| 2023 | 46.01% |
| 2022 | -9.35% |
| 2021 | 62.15% |
| 2020 | -26.84% |
| 2019 | 65.71% |
REVG Dividends
| Ex-Dividend Date | Type | Payout Amount | Change | ||||||
|---|---|---|---|---|---|---|---|---|---|
| Loading, please wait... | |||||||||
Continue Researching REVG
Here are a few links from around the web to help you further your research on REV Group Inc's stock as an investment opportunity:REV Group Inc (REVG) Stock Price | Nasdaq
REV Group Inc (REVG) Stock Quote, History and News - Yahoo Finance
REV Group Inc (REVG) Stock Price and Basic Information | MarketWatch
Loading social stream, please wait...