
Reynolds Consumer Products Inc. (REYN): Price and Financial Metrics
REYN Price/Volume Stats
| Current price | $27.79 | 52-week high | $30.54 |
| Prev. close | $27.36 | 52-week low | $24.80 |
| Day low | $27.28 | Volume | 301,900 |
| Day high | $27.86 | Avg. volume | 534,357 |
| 50-day MA | $27.95 | Dividend yield | 3.41% |
| 200-day MA | $27.61 | Market Cap | 5.84B |
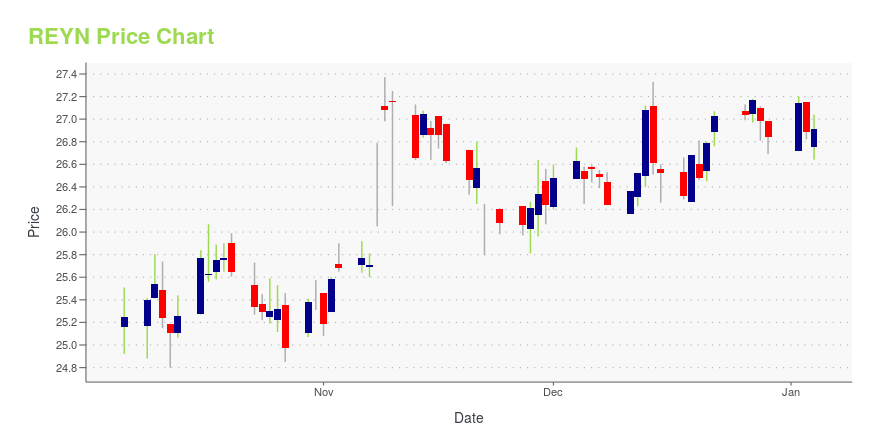
REYN Stock Price Chart Interactive Chart >
Reynolds Consumer Products Inc. (REYN) Company Bio
Reynolds Consumer Products, Inc. manufactures and sells household products. It operates through the following segments: Presto Products, Reynolds Cooking & Baking, Hefty Waste & Storage and Hefty Tableware. The Reynolds Cooking & Baking segment produces branded and store brand foil, disposable aluminum pans, parchment paper, freezer paper, wax paper, plastic wrap, baking cups, oven bags and slow cooker liners. The Hefty Waste & Storage segment produces both branded and store brand trash and food storage bags. Its products are sold under the Hefty Ultra Strong, Hefty Strong Trash Bags, Hefty Renew and Hefty Slider Bags brands. The Hefty Tableware segment sells both branded and store brand disposable and compostable plates, bowls, platters, cups and cutlery. The Presto Products segment sells store brand products in four main categories including food storage bags, trash bags, reusable storage containers and plastic wrap. The company was founded in 2010 and is headquartered in Lake Forest, IL
Latest REYN News From Around the Web
Below are the latest news stories about REYNOLDS CONSUMER PRODUCTS INC that investors may wish to consider to help them evaluate REYN as an investment opportunity.
Here's What To Make Of Reynolds Consumer Products' (NASDAQ:REYN) Decelerating Rates Of ReturnIf you're looking for a multi-bagger, there's a few things to keep an eye out for. Amongst other things, we'll want to... |
Hefty® Ultra Strong™ Trash Bags Recognized By Circana's 2022 List of New Product Pacesetters™Reynolds Consumer Products, the creator of Hefty® Ultra Strong™ trash bags, today announced that Hefty® Ultra Strong™ Fabuloso®* Scented tall kitchen trash bags have been recognized as one of the 2022 New Product Pacesetters™ of 2022. The 28th annual report, published by Circana, reveals the top new product launches across the food, beverage and non-food industries. |
Reynolds Consumer Products (NASDAQ:REYN) Is Due To Pay A Dividend Of $0.23Reynolds Consumer Products Inc. ( NASDAQ:REYN ) has announced that it will pay a dividend of $0.23 per share on the... |
Is It Worth Considering Reynolds Consumer Products Inc. (NASDAQ:REYN) For Its Upcoming Dividend?Some investors rely on dividends for growing their wealth, and if you're one of those dividend sleuths, you might be... |
Reynolds Consumer Products Inc. (NASDAQ:REYN) Q3 2023 Earnings Call TranscriptReynolds Consumer Products Inc. (NASDAQ:REYN) Q3 2023 Earnings Call Transcript November 8, 2023 Reynolds Consumer Products Inc. beats earnings expectations. Reported EPS is $0.37, expectations were $0.36. Operator: Greetings, and welcome to the Reynolds Consumer Products Third Quarter 2023 Earnings Conference Call. At this time, all participants are in a listen-only mode. A brief question […] |
REYN Price Returns
| 1-mo | -1.73% |
| 3-mo | -1.57% |
| 6-mo | 2.95% |
| 1-year | 4.05% |
| 3-year | 5.80% |
| 5-year | N/A |
| YTD | 5.22% |
| 2023 | -7.46% |
| 2022 | -1.46% |
| 2021 | 7.79% |
| 2020 | N/A |
| 2019 | N/A |
REYN Dividends
| Ex-Dividend Date | Type | Payout Amount | Change | ||||||
|---|---|---|---|---|---|---|---|---|---|
| Loading, please wait... | |||||||||
Loading social stream, please wait...