Reinsurance Group of America, Incorporated (RGA): Price and Financial Metrics
GET POWR RATINGS... FREE!
RGA POWR Grades
- RGA scores best on the Momentum dimension, with a Momentum rank ahead of 78.33% of US stocks.
- RGA's strongest trending metric is Momentum; it's been moving up over the last 179 days.
- RGA's current lowest rank is in the Growth metric (where it is better than 4.93% of US stocks).
RGA Stock Summary
- Price to trailing twelve month operating cash flow for RGA is currently 1.81, higher than only 5.63% of US stocks with positive operating cash flow.
- With a price/sales ratio of 0.45, Reinsurance Group Of America Inc has a higher such ratio than merely 9.87% of stocks in our set.
- The volatility of Reinsurance Group Of America Inc's share price is greater than that of only 13.54% US stocks with at least 200 days of trading history.
- If you're looking for stocks that are quantitatively similar to Reinsurance Group Of America Inc, a group of peers worth examining would be UNM, INGR, KNX, LU, and TPL.
- RGA's SEC filings can be seen here. And to visit Reinsurance Group Of America Inc's official web site, go to www.rgare.com.
RGA Valuation Summary
- In comparison to the median Financial Services stock, RGA's price/sales ratio is 58.33% lower, now standing at 0.5.
- Over the past 243 months, RGA's EV/EBIT ratio has gone down 4.5.
- Over the past 243 months, RGA's price/earnings ratio has gone down 10.
Below are key valuation metrics over time for RGA.
Stock | Date | P/S | P/B | P/E | EV/EBIT |
---|---|---|---|---|---|
RGA | 2015-11-16 | 0.6 | 0.9 | 11.0 | 8.0 |
RGA | 2014-09-18 | 0.5 | 0.9 | 9.3 | 6.7 |
RGA | 2009-12-11 | 0.5 | 0.9 | 11.2 | 8.8 |
RGA | 2007-07-12 | 0.7 | 1.3 | 12.4 | 9.9 |
RGA | 2005-08-19 | 0.6 | 1.1 | 14.7 | 9.2 |
RGA | 2001-08-29 | 1.0 | 2.0 | 19.9 | 11.0 |
RGA Growth Metrics
- The 2 year revenue growth rate now stands at 11.07%.
- The 2 year cash and equivalents growth rate now stands at 86.7%.
- Its 5 year revenue growth rate is now at 35.29%.

The table below shows RGA's growth in key financial areas (numbers in millions of US dollars).
Date | Revenue | Operating Cash Flow | Net Income to Common Stock |
---|---|---|---|
2021-12-31 | 16,658 | 4,182 | 617 |
2021-09-30 | 16,442 | 4,364 | 593 |
2021-06-30 | 16,042 | 3,073 | 828 |
2021-03-31 | 15,511 | 3,481 | 642 |
2020-12-31 | 14,596 | 3,322 | 415 |
2020-09-30 | 14,238 | 3,322.75 | 518.03 |
RGA's Quality Factors
The “Quality” component of the POWR Ratings focuses on 31 different factors of a companies fundamentals and operational strength. Here are some key insights as we drill into the specifics of these quality attributes.- RGA has a Quality Grade of C, ranking ahead of 38.3% of graded US stocks.
- RGA's asset turnover comes in at 0.188 -- ranking 85th of 133 Insurance stocks.
- JRVR, AXS, and CRVL are the stocks whose asset turnover ratios are most correlated with RGA.
The table below shows RGA's key quality metrics over time.
Period | Asset Turnover | Gross Margin | ROIC |
---|---|---|---|
2021-06-30 | 0.188 | 0.224 | 0.015 |
2021-03-31 | 0.187 | 0.207 | 0.012 |
2020-12-31 | 0.181 | 0.193 | 0.009 |
2020-09-30 | 0.181 | 0.206 | 0.011 |
2020-06-30 | 0.184 | 0.207 | 0.012 |
2020-03-31 | 0.188 | 0.215 | 0.013 |
RGA Price Target
For more insight on analysts targets of RGA, see our RGA price target page. And for a list of of all stocks sorted by upside potential based on analyst target price, see our Top Price Target page.
Average Price Target | $128.88 | Average Broker Recommendation | 1.89 (Hold) |
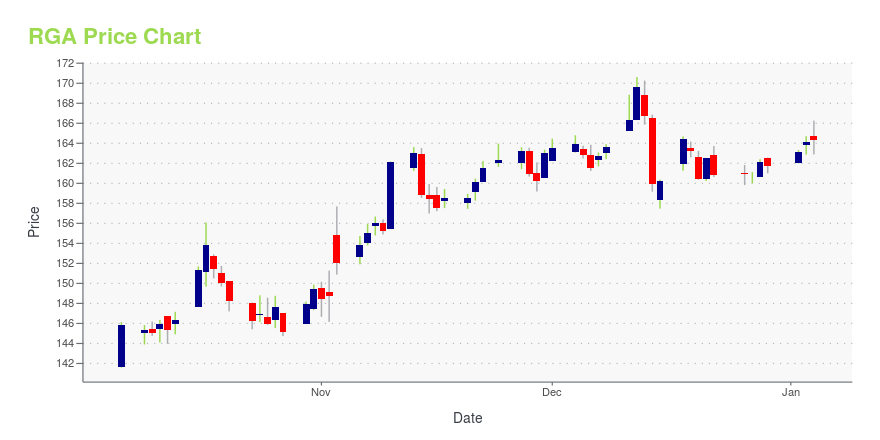
RGA Stock Price Chart Interactive Chart >
RGA Price/Volume Stats
Current price | $119.01 | 52-week high | $127.22 |
Prev. close | $117.29 | 52-week low | $94.32 |
Day low | $115.97 | Volume | 220,200 |
Day high | $119.44 | Avg. volume | 402,170 |
50-day MA | $117.24 | Dividend yield | 2.45% |
200-day MA | $112.50 | Market Cap | 7.97B |
Reinsurance Group of America, Incorporated (RGA) Company Bio
Reinsurance Group of America engages in the reinsurance business. It offers individual and group life and health insurance products, including term life, credit life, universal life, whole life, group life and health, joint and last survivor insurance, critical illness, disability, and longevity products, as well as asset-intensive and financial reinsurance products. The company was founded in 1973 and is based in Chesterfield, Missouri.
Latest RGA News From Around the Web
Below are the latest news stories about Reinsurance Group Of America Inc that investors may wish to consider to help them evaluate RGA as an investment opportunity.
REINSURANCE GROUP OF AMERICA INC – 10-K – MANAGEMENTapos;S DISCUSSION AND ANALYSIS OF FINANCIAL CONDITION AND RESULTS OF OPERATIONSIndex to Management''s Discussion and Analysis of Financial Condition and Results of Operations Page Cautionary Note Regarding Forward-Looking Statements 40 Overview 41 Industry Trends 43 Critical Accounting Policies 44 Consolidated Results of Operations 48 Results of Operations by Segment 52 U.S. and Latin America Operations 52 Canada Operations… The post REINSURANCE GROUP OF AMERICA INC – 10-K – MANAGEMENT''S DISCUSSION AND ANALYSIS OF FINANCIAL CONDITION AND RESULTS OF OPERATIONS appeared first on InsuranceNewsNet . |
American Equity (AEL) Q4 Earnings Lag Estimates, Revenues TopAmerican Equity (AEL) Q4 results reflect higher investment spread, lower expenses and higher premiums. |
2 Stocks Trading Below the GF Value LineWhen looking for bargains, value investors could be interested in these stocks |
Reinsurance Group of America Announces Longevity Reinsurance Transaction With NN LifeAMSTERDAM, February 17, 2022--Reinsurance Group of America, Incorporated (NYSE: RGA), a leading global life and health reinsurer, today announced the completion of a longevity reinsurance transaction with NN Life, the largest life insurance company in the Netherlands. The reinsurance transaction covers approximately €4 billion of underlying reserves. |
Primerica's (PRI) Q4 Earnings Lag, Revenues Top EstimatesPrimerica's (PRI) Q4 results reflect better performance at term life insurance and investment businesses. |
RGA Price Returns
1-mo | -3.55% |
3-mo | 9.79% |
6-mo | 7.85% |
1-year | 6.25% |
3-year | -19.38% |
5-year | 0.40% |
YTD | 10.08% |
2021 | -3.21% |
2020 | -27.02% |
2019 | 18.29% |
2018 | -8.71% |
2017 | 25.59% |
RGA Dividends
Ex-Dividend Date | Type | Payout Amount | Change | ||||||
---|---|---|---|---|---|---|---|---|---|
Loading, please wait... |
Continue Researching RGA
Here are a few links from around the web to help you further your research on Reinsurance Group Of America Inc's stock as an investment opportunity:Reinsurance Group Of America Inc (RGA) Stock Price | Nasdaq
Reinsurance Group Of America Inc (RGA) Stock Quote, History and News - Yahoo Finance
Reinsurance Group Of America Inc (RGA) Stock Price and Basic Information | MarketWatch
Loading social stream, please wait...