REGENXBIO Inc. (RGNX): Price and Financial Metrics
RGNX Price/Volume Stats
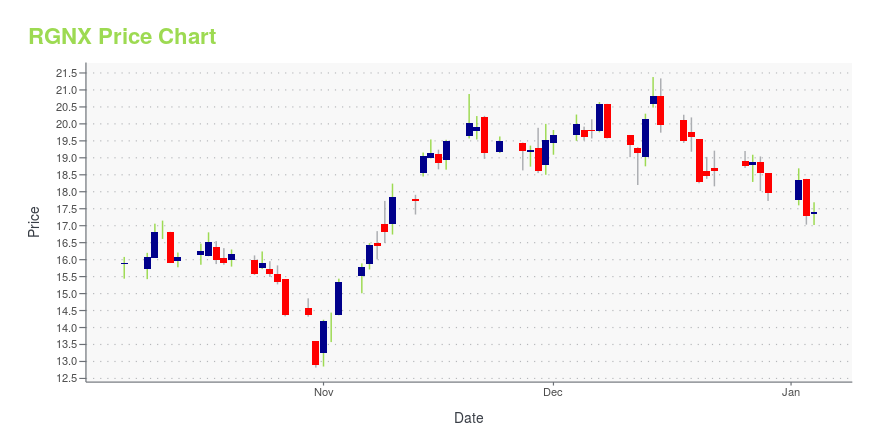
Current price | $17.11 | 52-week high | $27.20 |
Prev. close | $17.62 | 52-week low | $16.93 |
Day low | $17.10 | Volume | 363,900 |
Day high | $17.62 | Avg. volume | 388,929 |
50-day MA | $18.00 | Dividend yield | N/A |
200-day MA | $20.16 | Market Cap | 752.16M |
RGNX Stock Price Chart Interactive Chart >
RGNX POWR Grades
- Value is the dimension where RGNX ranks best; there it ranks ahead of 70.29% of US stocks.
- The strongest trend for RGNX is in Quality, which has been heading up over the past 179 days.
- RGNX ranks lowest in Sentiment; there it ranks in the 8th percentile.
RGNX Stock Summary
- Of note is the ratio of REGENXBIO INC's sales and general administrative expense to its total operating expenses; merely 11.66% of US stocks have a lower such ratio.
- In terms of twelve month growth in earnings before interest and taxes, REGENXBIO INC is reporting a growth rate of -299.62%; that's higher than merely 5.06% of US stocks.
- As for revenue growth, note that RGNX's revenue has grown -79.98% over the past 12 months; that beats the revenue growth of merely 2.15% of US companies in our set.
- Stocks with similar financial metrics, market capitalization, and price volatility to REGENXBIO INC are SELB, TSVT, ENTA, VIR, and STRO.
- Visit RGNX's SEC page to see the company's official filings. To visit the company's web site, go to www.regenxbio.com.
RGNX Valuation Summary
- In comparison to the median Healthcare stock, RGNX's price/earnings ratio is 110.64% lower, now standing at -2.9.
- Over the past 97 months, RGNX's price/sales ratio has gone down 197.7.
Below are key valuation metrics over time for RGNX.
Stock | Date | P/S | P/B | P/E | EV/EBIT |
---|---|---|---|---|---|
RGNX | 2023-09-18 | 8.1 | 1.9 | -2.9 | -3.1 |
RGNX | 2023-09-15 | 8.1 | 1.9 | -2.9 | -3.1 |
RGNX | 2023-09-14 | 8.2 | 2.0 | -2.9 | -3.1 |
RGNX | 2023-09-13 | 8.2 | 2.0 | -2.9 | -3.1 |
RGNX | 2023-09-12 | 7.9 | 1.9 | -2.8 | -3.0 |
RGNX | 2023-09-11 | 7.8 | 1.9 | -2.8 | -3.0 |
RGNX Growth Metrics
- The year over year net cashflow from operations growth rate now stands at 442.33%.
- Its year over year revenue growth rate is now at 204.02%.
- The 5 year revenue growth rate now stands at 1017.89%.

The table below shows RGNX's growth in key financial areas (numbers in millions of US dollars).
Date | Revenue | Operating Cash Flow | Net Income to Common Stock |
---|---|---|---|
2022-09-30 | 480.034 | 158.121 | 73.637 |
2022-06-30 | 484.295 | 172.218 | 90.716 |
2022-03-31 | 473.681 | 204.095 | 101.256 |
2021-12-31 | 470.347 | 218.875 | 127.84 |
2021-09-30 | 93.137 | -67.894 | -212.424 |
2021-06-30 | 161.276 | -67.995 | -145.228 |
RGNX's Quality Factors
The “Quality” component of the POWR Ratings focuses on 31 different factors of a companies fundamentals and operational strength. Here are some key insights as we drill into the specifics of these quality attributes.- RGNX has a Quality Grade of D, ranking ahead of 18.52% of graded US stocks.
- RGNX's asset turnover comes in at 0.116 -- ranking 250th of 682 Pharmaceutical Products stocks.
- PTGX, ARDX, and CBAY are the stocks whose asset turnover ratios are most correlated with RGNX.
The table below shows RGNX's key quality metrics over time.
Period | Asset Turnover | Gross Margin | ROIC |
---|---|---|---|
2021-09-30 | 0.116 | 0.581 | -0.362 |
2021-06-30 | 0.218 | 0.738 | -0.257 |
2021-03-31 | 0.242 | 0.762 | -0.255 |
2020-12-31 | 0.286 | 0.769 | -0.281 |
2020-09-30 | 0.297 | 0.798 | -0.244 |
2020-06-30 | 0.126 | 0.763 | -0.367 |
RGNX Price Target
For more insight on analysts targets of RGNX, see our RGNX price target page. And for a list of of all stocks sorted by upside potential based on analyst target price, see our Top Price Target page.
Average Price Target | $64.00 | Average Broker Recommendation | 1.5 (Moderate Buy) |
REGENXBIO Inc. (RGNX) Company Bio
REGENXBIO is a leading biotechnology company focused on the development, commercialization and licensing of recombinant adeno-associated virus (AAV) gene therapy. The company was founded in 2009 and is based in Rockville, Maryland.
Latest RGNX News From Around the Web
Below are the latest news stories about REGENXBIO INC that investors may wish to consider to help them evaluate RGNX as an investment opportunity.
We're Keeping An Eye On REGENXBIO's (NASDAQ:RGNX) Cash Burn RateEven when a business is losing money, it's possible for shareholders to make money if they buy a good business at the... |
REGENXBIO to Participate in Upcoming Investor ConferencesREGENXBIO Inc. (Nasdaq: RGNX) today announced it will participate in the following upcoming investor conferences: |
Initial Clinical Data of First Pediatric CLN2 Patient Dosed with RGX-181 Presented at SSIEM Annual SymposiumREGENXBIO Inc. (Nasdaq: RGNX) today announced that initial interim data from a first-in-human single-patient, investigator-initiated trial of RGX-181 for the treatment of late-infantile neuronal ceroid lipofuscinosis type 2 (CLN2) disease, a form of Batten disease, were presented at the Society for the Study of Inborn Errors of Metabolism (SSIEM) Annual Symposium in Jerusalem. |
REGENXBIO Announces Presentations at the Society for the Study of Inborn Errors of Metabolism Annual Symposium 2023REGENXBIO Inc. (Nasdaq: RGNX) today announced presentations at the Society for the Study of Inborn Errors of Metabolism Annual Symposium 2023 in Jerusalem, Israel (August 29 – September 1). Investigators will deliver encore presentations of interim clinical trial data from REGENXBIO's pipeline of one-time investigational AAV Therapeutics for progressive, neurodegenerative lysosomal storage disorders, as well as initial interim data from the single-patient, investigator-initiated study of RGX-181 |
Regenxbio (RGNX) Reports Q2 Loss, Lags Revenue EstimatesRegenxbio (RGNX) delivered earnings and revenue surprises of -31.75% and 49.85%, respectively, for the quarter ended June 2023. Do the numbers hold clues to what lies ahead for the stock? |
RGNX Price Returns
1-mo | -5.73% |
3-mo | -7.11% |
6-mo | -9.13% |
1-year | -25.15% |
3-year | -36.65% |
5-year | -76.69% |
YTD | -24.56% |
2022 | -30.64% |
2021 | -27.91% |
2020 | 10.72% |
2019 | -2.34% |
2018 | 26.17% |
Continue Researching RGNX
Want to do more research on REGENXBIO Inc's stock and its price? Try the links below:REGENXBIO Inc (RGNX) Stock Price | Nasdaq
REGENXBIO Inc (RGNX) Stock Quote, History and News - Yahoo Finance
REGENXBIO Inc (RGNX) Stock Price and Basic Information | MarketWatch
Loading social stream, please wait...