B. Riley Financial, Inc. (RILY): Price and Financial Metrics

B. Riley Financial, Inc. (RILY): $36.29

-0.30 (-0.82%)

POWR Rating

Component Grades

Momentum

B

Stability

D

Sentiment

Quality

C

Add RILY to Watchlist
Sign Up

Industry: Asset Management

Industry

D

Ranked

#30 of 54

in industry

RILY Price/Volume Stats

Current price $36.29 52-week high $59.09
Prev. close $36.59 52-week low $24.95
Day low $35.35 Volume 87,672
Day high $36.44 Avg. volume 468,336
50-day MA $31.74 Dividend yield 10.52%
200-day MA $40.19 Market Cap 1.02B

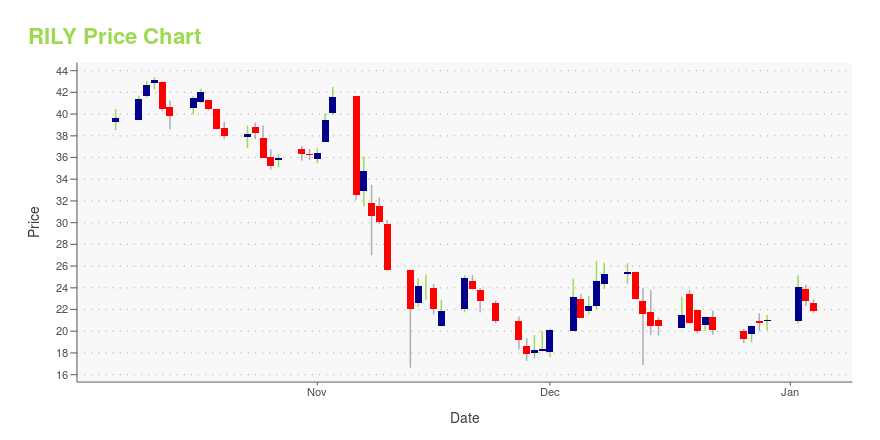
RILY Stock Price Chart Interactive Chart >

RILY POWR Grades

  • RILY scores best on the Growth dimension, with a Growth rank ahead of 99.73% of US stocks.
  • The strongest trend for RILY is in Quality, which has been heading down over the past 179 days.
  • RILY's current lowest rank is in the Stability metric (where it is better than 7.15% of US stocks).

RILY Stock Summary

  • B RILEY FINANCIAL INC's capital turnover -- a measure of revenue relative to shareholder's equity -- is better than 84.84% of US listed stocks.
  • Of note is the ratio of B RILEY FINANCIAL INC's sales and general administrative expense to its total operating expenses; 84.68% of US stocks have a lower such ratio.
  • RILY's equity multiplier -- a measure of assets relative to shareholders'equity -- is greater than that of 94.84% of US stocks.
  • Stocks that are quantitatively similar to RILY, based on their financial statements, market capitalization, and price volatility, are BCO, EDBL, HOV, EAST, and OII.
  • RILY's SEC filings can be seen here. And to visit B RILEY FINANCIAL INC's official web site, go to www.brileyfin.com.

RILY Valuation Summary

  • RILY's price/earnings ratio is -7.3; this is 185.88% lower than that of the median Financial Services stock.
  • Over the past 169 months, RILY's price/earnings ratio has gone down 24.3.

Below are key valuation metrics over time for RILY.

Stock Date P/S P/B P/E EV/EBIT
RILY 2023-05-19 0.8 2.7 -7.3 56.6
RILY 2023-05-18 0.8 2.7 -7.3 56.6
RILY 2023-05-17 0.8 2.7 -7.3 56.6
RILY 2023-05-16 0.7 2.5 -6.7 55.3
RILY 2023-05-15 0.7 2.5 -6.7 55.1
RILY 2023-05-12 0.7 2.5 -6.9 55.6

RILY Growth Metrics

    The year over year cash and equivalents growth rate now stands at -12.84%.
  • The 4 year net cashflow from operations growth rate now stands at -191.5%.
  • Its year over year revenue growth rate is now at -10.45%.
RILY's revenue has moved up $579,625,000 over the prior 49 months.

The table below shows RILY's growth in key financial areas (numbers in millions of US dollars).

Date Revenue Operating Cash Flow Net Income to Common Stock
2022-09-30 1,010.762 144.732 -46.208
2022-06-30 1,051.921 148.896 -43.422
2022-03-31 1,345.991 78.89 172.626
2021-12-31 1,740.561 50.894 437.597
2021-09-30 1,728.657 -195.86 545.529
2021-06-30 1,573.388 -103.644 544.199

RILY's Quality Factors

The “Quality” component of the POWR Ratings focuses on 31 different factors of a companies fundamentals and operational strength. Here are some key insights as we drill into the specifics of these quality attributes.
  • RILY has a Quality Grade of B, ranking ahead of 91.21% of graded US stocks.
  • RILY's asset turnover comes in at 0.477 -- ranking 334th of 563 Business Services stocks.
  • MSTR, PRAA, and SLNM are the stocks whose asset turnover ratios are most correlated with RILY.

The table below shows RILY's key quality metrics over time.

Period Asset Turnover Gross Margin ROIC
2021-06-30 0.477 0.952 0.217
2021-03-31 0.529 0.954 0.261
2020-12-31 0.385 0.919 0.139
2020-09-30 0.291 0.894 0.066
2020-06-30 0.276 0.918 0.058
2020-03-31 0.239 0.868 0.023

B. Riley Financial, Inc. (RILY) Company Bio


B. Riley Financial, Inc. provides corporate finance, research, sales, and trading services to corporate, institutional, and high net worth clients. The company was founded in 1973 and is based in Woodland Hills, California.


RILY Latest News Stream


Event/Time News Detail
Loading, please wait...

RILY Latest Social Stream


Loading social stream, please wait...

View Full RILY Social Stream

Latest RILY News From Around the Web

Below are the latest news stories about B RILEY FINANCIAL INC that investors may wish to consider to help them evaluate RILY as an investment opportunity.

B. Riley Announces Sponsors of 2023 Annual Institutional Investor Conference

B. Riley Securities, subsidiary of B. Riley Financial (Nasdaq: RILY) ("B. Riley"), today announced participating companies and sponsors for its 2023 Institutional Investor Conference which takes place May 24th and 25th in Beverly Hills, CA.

Yahoo | May 18, 2023

B. Riley Acquires Interest in Scotch & Soda; Expands Brand Investments Portfolio

B. Riley Financial, Inc. (NASDAQ: RILY) ("B. Riley"), a diversified financial services platform, today announced it has acquired an equity interest in Scotch & Soda through its participation in the recent acquisition of the fashion brand by New York-based brand management company, Bluestar Alliance, LLC ("Bluestar").

Yahoo | May 17, 2023

Insider Buys Additional US$866k In B. Riley Financial Stock \

Those following along with B. Riley Financial, Inc. ( NASDAQ:RILY ) will no doubt be intrigued by the recent purchase...

Yahoo | May 16, 2023

B. Riley Announces 2023 Commissions for Charity Day on May 18 to Benefit Toigo Foundation and Sugar Ray Leonard Foundation

B. Riley Securities, together with B. Riley Financial (Nasdaq: RILY) (collectively, "B. Riley"), is pleased to announce that its annual Commissions for Charity Day will take place on Thursday May 18, 2023.

Yahoo | May 11, 2023

B. Riley Financial, Inc. (NASDAQ:RILY) Q1 2023 Earnings Call Transcript

B. Riley Financial, Inc. (NASDAQ:RILY) Q1 2023 Earnings Call Transcript May 5, 2023 Operator: Good afternoon and welcome to B. Riley Financial’s First Quarter 2023 Earnings Call. My name is Harry and I will be your call coordinator. Earlier this afternoon, B. Riley issued its first quarter earnings release and financial supplement. Copies can be […]

Yahoo | May 9, 2023

Read More 'RILY' Stories Here

RILY Price Returns

1-mo 21.51%
3-mo -0.65%
6-mo -16.61%
1-year -26.58%
3-year 164.88%
5-year 174.97%
YTD 12.07%
2022 -58.43%
2021 140.92%
2020 85.74%
2019 89.38%
2018 -18.63%

RILY Dividends

Ex-Dividend Date Type Payout Amount Change
Loading, please wait...
View Full RILY Dividend History

Continue Researching RILY

Here are a few links from around the web to help you further your research on B Riley Financial Inc's stock as an investment opportunity:

B Riley Financial Inc (RILY) Stock Price | Nasdaq
B Riley Financial Inc (RILY) Stock Quote, History and News - Yahoo Finance
B Riley Financial Inc (RILY) Stock Price and Basic Information | MarketWatch

Get Free Updates

Join thousands of investors who get the latest news, insights and top rated picks from StockNews.com!