
Rocket Lab USA, Inc., (RKLB): Price and Financial Metrics
RKLB Price/Volume Stats
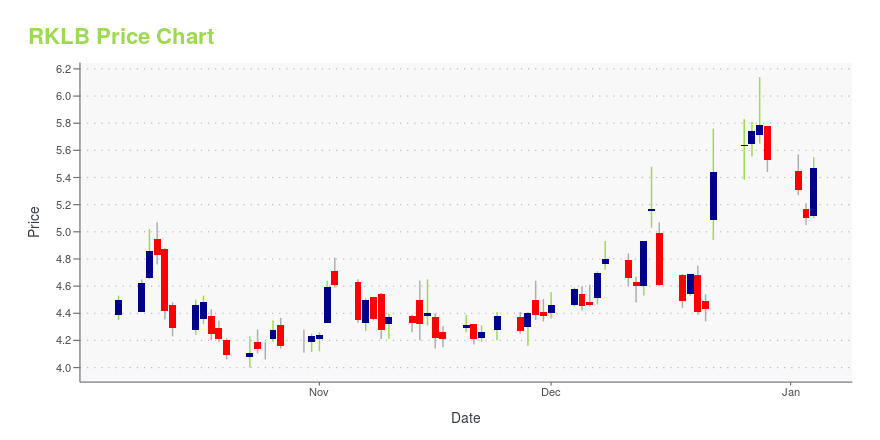
| Current price | $5.40 | 52-week high | $7.49 |
| Prev. close | $5.25 | 52-week low | $3.47 |
| Day low | $5.30 | Volume | 4,422,448 |
| Day high | $5.46 | Avg. volume | 7,936,036 |
| 50-day MA | $4.76 | Dividend yield | N/A |
| 200-day MA | $4.50 | Market Cap | 2.66B |
RKLB Stock Price Chart Interactive Chart >
Rocket Lab USA, Inc., (RKLB) Company Bio
Rocket Lab USA, Inc., an aerospace company, focuses on developing rocket launch and control systems for the space and defense industries. The company provides launch services, spacecraft components, satellites and other spacecraft, and on-orbit management solutions; and designs, manufactures, and sells Electron and Neutron launch vehicles, as well as offers Photon platform for spacecraft solutions. It serves customers in commercial, civil, defense, and academic sectors. The company was founded in 2006 and is headquartered in Long Beach, California.
Latest RKLB News From Around the Web
Below are the latest news stories about ROCKET LAB USA INC that investors may wish to consider to help them evaluate RKLB as an investment opportunity.
The 3 Hottest Space Stocks to Watch in 2024With our currently improving economy looking ripe to grow in 2024, now is the time to invest in the hottest space stocks. |
Reality Check: AI Predicts These 3 Stocks Can 10x in 5 Years. Here’s Why They Won’t.Investors shouldn't blindly use AI stock predictions because it is not infallible and can miss important facts about a business. |
7 Small-Cap Stocks With 10X Potential in 2024Small-cap stocks nearly tripled the S&P 500's December performance as bullish tailwinds push companies to new heights. |
Budget Bets: 3 Penny Stocks Ready for a Big Break in 2024Uncover the gems among bargain penny stocks for 2024 where strategic expansion and strong financials offer a gateway to lucrative investment. |
Is Rocket Lab A Solid Growth Stock Play For 2024?Rocket Lab's parity with SpaceX is steadily closing. Demand for reliable, cost-effective launches is only going to increase. |
RKLB Price Returns
| 1-mo | 13.45% |
| 3-mo | 43.24% |
| 6-mo | 10.66% |
| 1-year | -19.76% |
| 3-year | -48.37% |
| 5-year | N/A |
| YTD | -2.35% |
| 2023 | 46.68% |
| 2022 | -69.30% |
| 2021 | 21.46% |
| 2020 | N/A |
| 2019 | N/A |
Loading social stream, please wait...