
Renasant Corporation (RNST): Price and Financial Metrics
RNST Price/Volume Stats
| Current price | $37.09 | 52-week high | $37.40 |
| Prev. close | $36.41 | 52-week low | $22.99 |
| Day low | $36.20 | Volume | 357,500 |
| Day high | $37.14 | Avg. volume | 243,229 |
| 50-day MA | $31.06 | Dividend yield | 2.4% |
| 200-day MA | $30.15 | Market Cap | 2.09B |
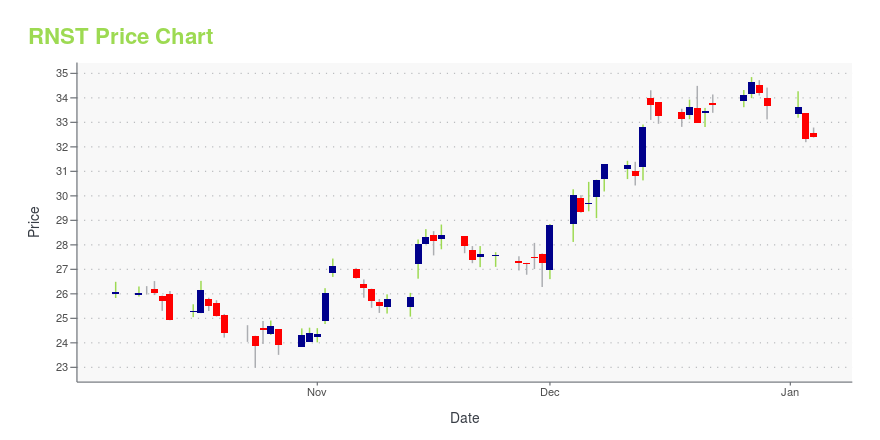
RNST Stock Price Chart Interactive Chart >
Renasant Corporation (RNST) Company Bio
Renasant Corporation provides financial, fiduciary, and insurance services to retail and commercial customers in Mississippi, Tennessee, Alabama, and Georgia. The company was founded in 1904 and is based in Tupelo, Mississippi.
Latest RNST News From Around the Web
Below are the latest news stories about RENASANT CORP that investors may wish to consider to help them evaluate RNST as an investment opportunity.
Renasant Corporation Declares Quarterly DividendTUPELO, Miss., Nov. 09, 2023 (GLOBE NEWSWIRE) -- The board of directors of Renasant Corporation (NYSE: RNST) approved the payment of a quarterly cash dividend of twenty-two cents ($0.22) per share to be paid January 1, 2024, to shareholders of record as of December 18, 2023. ABOUT RENASANT CORPORATION:Renasant Corporation is the parent of Renasant Bank, a 119-year-old financial services institution. Renasant has assets of approximately $17.2 billion and operates 194 banking, lending, mortgage, w |
Renasant Corporation (NASDAQ:RNST) Q3 2023 Earnings Call TranscriptRenasant Corporation (NASDAQ:RNST) Q3 2023 Earnings Call Transcript October 25, 2023 Operator: Good day and welcome to Renasant Corporation 2023 Third Quarter Earnings Conference Call and Webcast. All participants will be in listen-only mode. [Operator Instructions] After today’s presentation, there will be an opportunity to ask questions. Please note that this event is being recorded. […] |
Renasant Corporation Announces Earnings for the Third Quarter of 2023TUPELO, Miss., Oct. 24, 2023 (GLOBE NEWSWIRE) -- Renasant Corporation (NYSE: RNST) (the “Company”) today announced earnings results for the third quarter of 2023. (Dollars in thousands, except earnings per share)Three Months Ended Nine Months Ended Sep 30, 2023Jun 30, 2023Sep 30, 2022 Sep 30, 2023Sep 30, 2022Net income and earnings per share: Net income$42,332$28,643 $46,567 $117,053 $119,792After-tax loss on sale of securities — (18,085) — (17,859) —Basic EPS 0.75 0.51 0.83 2.09 2.14Diluted EPS |
Renasant Announces 2023 Third Quarter Webcast and Conference Call InformationTUPELO, Miss., Oct. 12, 2023 (GLOBE NEWSWIRE) -- Renasant Corporation (NYSE: RNST) (the “Company”) will announce 2023 third quarter results following the NYSE's closing on Tuesday, October 24, 2023. The Company will hold executive management's quarterly webcast and conference call with analysts on Wednesday, October 25, 2023, at 10:00 AM Eastern Time (9:00 AM Central Time). The webcast is accessible through Renasant's investor relations website at www.renasant.com or https://event.choruscall.com |
Renasant (NASDAQ:RNST) shareholders have endured a 30% loss from investing in the stock five years agoFor many, the main point of investing is to generate higher returns than the overall market. But even the best stock... |
RNST Price Returns
| 1-mo | 24.42% |
| 3-mo | 25.20% |
| 6-mo | 11.08% |
| 1-year | 24.61% |
| 3-year | 13.93% |
| 5-year | 20.84% |
| YTD | 11.77% |
| 2023 | -7.70% |
| 2022 | 1.70% |
| 2021 | 15.28% |
| 2020 | -1.62% |
| 2019 | 20.24% |
RNST Dividends
| Ex-Dividend Date | Type | Payout Amount | Change | ||||||
|---|---|---|---|---|---|---|---|---|---|
| Loading, please wait... | |||||||||
Continue Researching RNST
Here are a few links from around the web to help you further your research on Renasant Corp's stock as an investment opportunity:Renasant Corp (RNST) Stock Price | Nasdaq
Renasant Corp (RNST) Stock Quote, History and News - Yahoo Finance
Renasant Corp (RNST) Stock Price and Basic Information | MarketWatch
Loading social stream, please wait...