
Rockwell Automation Inc. (ROK): Price and Financial Metrics
ROK Price/Volume Stats
| Current price | $277.04 | 52-week high | $339.65 |
| Prev. close | $271.00 | 52-week low | $249.00 |
| Day low | $273.48 | Volume | 689,200 |
| Day high | $278.63 | Avg. volume | 976,778 |
| 50-day MA | $266.25 | Dividend yield | 1.84% |
| 200-day MA | $278.41 | Market Cap | 31.58B |
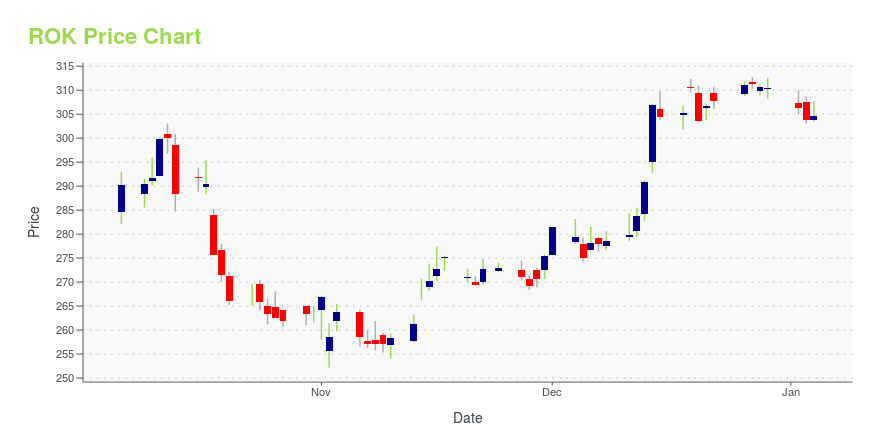
ROK Stock Price Chart Interactive Chart >
Rockwell Automation Inc. (ROK) Company Bio
Rockwell Automation, Inc. is an American provider of industrial automation and digital transformation. Their brands include Allen-Bradley, FactoryTalk software and LifecycleIQ Services. (Source:Wikipedia)
Latest ROK News From Around the Web
Below are the latest news stories about ROCKWELL AUTOMATION INC that investors may wish to consider to help them evaluate ROK as an investment opportunity.
AI and Automation: 3 Stocks Leading the Digital Revolution in 2024Get the edge in the market with expert advice on AI and automation stocks. |
Rockwell Automation (ROK) Outpaces Stock Market Gains: What You Should KnowRockwell Automation (ROK) concluded the recent trading session at $310.48, signifying a +1.7% move from its prior day's close. |
Rockwell Automation (NYSE:ROK) Will Want To Turn Around Its Return TrendsDid you know there are some financial metrics that can provide clues of a potential multi-bagger? Firstly, we'll want... |
Amgen raised to Outperform on 'promising pipeline': 4 big analyst picksHere is your Pro Recap of the biggest analyst picks you may have missed today: upgrades at Amgen, Sunrun, American International Group, and Rockwell Automation. BMO Capital upgraded Amgen (NASDAQ:AMGN) to Outperform from Market Perform and raised its price target to $326.00 from $286.00. The analysts noted that the upgrade is based on several key factors:Amgen's emerging oral and injectable metabolic pipeline presents an attractive investment opportunity in the obesity metabolic market without the same premium as peers; The completion of the Horizon deal is seen as a strategic move to offset revenues lost to base business erosion; Amgen's promising pipeline, with numerous potential catalysts through 2024, is expected to foster further expansion of its multiple. |
Rockwell Automation (ROK) Ascends But Remains Behind Market: Some Facts to NoteIn the most recent trading session, Rockwell Automation (ROK) closed at $305.30, indicating a +0.31% shift from the previous trading day. |
ROK Price Returns
| 1-mo | 3.76% |
| 3-mo | -0.64% |
| 6-mo | -7.73% |
| 1-year | -14.61% |
| 3-year | -0.15% |
| 5-year | 85.23% |
| YTD | -9.96% |
| 2023 | 22.63% |
| 2022 | -24.44% |
| 2021 | 41.21% |
| 2020 | 26.17% |
| 2019 | 37.85% |
ROK Dividends
| Ex-Dividend Date | Type | Payout Amount | Change | ||||||
|---|---|---|---|---|---|---|---|---|---|
| Loading, please wait... | |||||||||
Continue Researching ROK
Here are a few links from around the web to help you further your research on Rockwell Automation Inc's stock as an investment opportunity:Rockwell Automation Inc (ROK) Stock Price | Nasdaq
Rockwell Automation Inc (ROK) Stock Quote, History and News - Yahoo Finance
Rockwell Automation Inc (ROK) Stock Price and Basic Information | MarketWatch
Loading social stream, please wait...