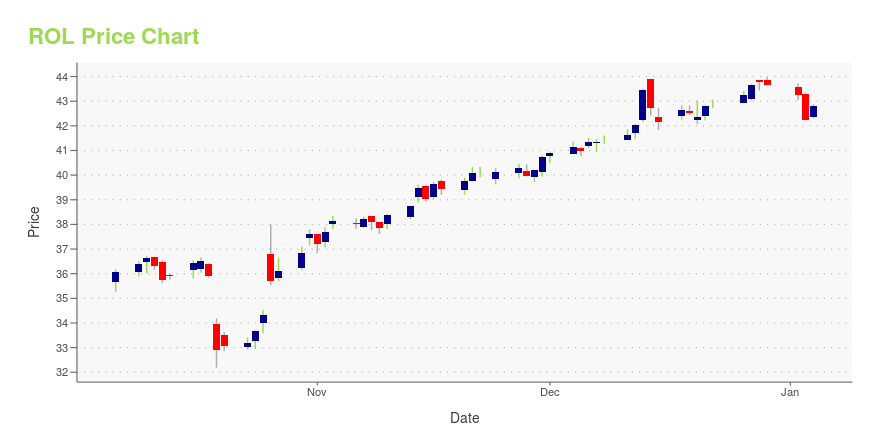
Rollins Inc. (ROL): Price and Financial Metrics
ROL Price/Volume Stats
| Current price | $45.93 | 52-week high | $50.87 |
| Prev. close | $46.73 | 52-week low | $32.19 |
| Day low | $45.58 | Volume | 2,683,800 |
| Day high | $46.76 | Avg. volume | 1,791,511 |
| 50-day MA | $48.15 | Dividend yield | 1.2% |
| 200-day MA | $43.84 | Market Cap | 22.24B |
ROL Stock Price Chart Interactive Chart >
Rollins Inc. (ROL) Company Bio
Rollins, Inc. is a North American pest control company serving residential and commercial clients. Operating globally through its wholly owned subsidiaries, Orkin, Inc., PCO Services (now Orkin Canada), HomeTeam Pest Defense, Western Pest Services, Industrial Fumigant Company, TruTech, Critter Control, Crane, Waltham, OPC Services, PermaTreat, Northwest Exterminating, McCall Service and Clark Pest Control, as well UK subsidiaries Safeguard Pest Control, NBC Environment, Europest Environmental Services, Guardian Pest Control, Ames, and Kestrel, with Australian subsidiaries Allpest, Scientific Pest Control, Murray Pest Control and Statewide Pest Control, and Singapore subsidiary Aardwolf Pestkare, the company provides pest control services and protection against termite damage, rodents and insects to over 2 million customers in the US, Canada, United Kingdom, Mexico, Central America, the Caribbean, the Middle East and Asia from over 500 locations. (Source:Wikipedia)
Latest ROL News From Around the Web
Below are the latest news stories about ROLLINS INC that investors may wish to consider to help them evaluate ROL as an investment opportunity.
6 Reasons Why You Should Bet on Rollins (ROL) Stock NowCommitment to shareholder returns makes Rollins (ROL) a reliable way for investors to compound wealth over the long term. |
Fund manager's top growth stock picks for 2024As 2023 comes to a close, Clough Capital CEO and President Vince Lorusso discusses his top stock picks as we move into the new year. When discussing the funds he manages, Lorusso says, "There's really two different areas of investments. I kind of characterize them as stable growth companies, meaning they might be a little bit more defensive if we do have a little bit of a slowdown in the consumer." Lorusso's top picks for stable growth include Service Corporation International (SCI), Rollins, Inc. (ROL), and gold miners and utilities sectors. "In the other part of the portfolio, are these more dynamic growth companies that we think do have more beta potentially and are most exposed to some of the secular and also cyclical enthusiasm we're seeing around things like AI and EVs." Lorusso's... |
Mastercard (MA) Solutions Suite to Ease Payments in NigeriaMastercard (MA) extends its contactless payment solutions suite to merchants and consumers of Nigeria, who will benefit from the seamless processing of payments. |
Why Rollins (ROL) is a Top Stock for the Long-TermFinding strong, market-beating stocks with a positive earnings outlook becomes easier with the Focus List, a top feature of the Zacks Premium portfolio service. |
Insider Sell Alert: Rollins Inc's President & CEO Jerry Gahlhoff Sells 3,000 SharesRollins Inc (NYSE:ROL), a global consumer and commercial services company, has recently witnessed a significant insider sell by its President & |
ROL Price Returns
| 1-mo | -7.10% |
| 3-mo | 2.62% |
| 6-mo | 6.98% |
| 1-year | 14.11% |
| 3-year | 28.68% |
| 5-year | 113.58% |
| YTD | 5.90% |
| 2023 | 21.19% |
| 2022 | 8.10% |
| 2021 | -11.43% |
| 2020 | 78.28% |
| 2019 | -6.95% |
ROL Dividends
| Ex-Dividend Date | Type | Payout Amount | Change | ||||||
|---|---|---|---|---|---|---|---|---|---|
| Loading, please wait... | |||||||||
Continue Researching ROL
Here are a few links from around the web to help you further your research on Rollins Inc's stock as an investment opportunity:Rollins Inc (ROL) Stock Price | Nasdaq
Rollins Inc (ROL) Stock Quote, History and News - Yahoo Finance
Rollins Inc (ROL) Stock Price and Basic Information | MarketWatch


Loading social stream, please wait...