RPM International Inc. (RPM): Price and Financial Metrics
GET POWR RATINGS... FREE!
RPM POWR Grades
- Growth is the dimension where RPM ranks best; there it ranks ahead of 80.94% of US stocks.
- The strongest trend for RPM is in Momentum, which has been heading down over the past 177 days.
- RPM's current lowest rank is in the Sentiment metric (where it is better than 17.84% of US stocks).
RPM Stock Summary
- RPM's one year PEG ratio, measuring expected growth in earnings next year relative to current common stock price is 198.53 -- higher than 87.83% of US-listed equities with positive expected earnings growth.
- The price/operating cash flow metric for RPM INTERNATIONAL INC is higher than 91.4% of stocks in our set with a positive cash flow.
- Of note is the ratio of RPM INTERNATIONAL INC's sales and general administrative expense to its total operating expenses; 96.57% of US stocks have a lower such ratio.
- Stocks that are quantitatively similar to RPM, based on their financial statements, market capitalization, and price volatility, are TTC, J, RL, WSO, and AOS.
- RPM's SEC filings can be seen here. And to visit RPM INTERNATIONAL INC's official web site, go to www.rpminc.com.
RPM Valuation Summary
- In comparison to the median Basic Materials stock, RPM's price/sales ratio is 23.08% higher, now standing at 1.6.
- RPM's price/sales ratio has moved up 1 over the prior 243 months.
Below are key valuation metrics over time for RPM.
Stock | Date | P/S | P/B | P/E | EV/EBIT |
---|---|---|---|---|---|
RPM | 2023-01-24 | 1.6 | 5.4 | 21.3 | 18.6 |
RPM | 2023-01-23 | 1.6 | 5.4 | 21.1 | 18.5 |
RPM | 2023-01-20 | 1.6 | 5.4 | 21.1 | 18.5 |
RPM | 2023-01-19 | 1.5 | 5.2 | 20.3 | 17.9 |
RPM | 2023-01-18 | 1.5 | 5.3 | 20.8 | 18.3 |
RPM | 2023-01-17 | 1.6 | 5.4 | 21.0 | 18.5 |
RPM Growth Metrics
- Its 4 year price growth rate is now at 25.11%.
- The 2 year revenue growth rate now stands at 14.49%.
- Its 5 year net cashflow from operations growth rate is now at 24.57%.

The table below shows RPM's growth in key financial areas (numbers in millions of US dollars).
Date | Revenue | Operating Cash Flow | Net Income to Common Stock |
---|---|---|---|
2022-12-31 | 7,141.797 | 210.291 | 532.381 |
2022-09-30 | 6,989.627 | 126.179 | 525.912 |
2022-06-30 | 6,707.728 | 178.731 | 491.481 |
2022-03-31 | 6,468.144 | 270.201 | 448.623 |
2021-12-31 | 6,303.66 | 346.008 | 453.846 |
2021-09-30 | 6,150.037 | 524.174 | 456.63 |
RPM's Quality Factors
The “Quality” component of the POWR Ratings focuses on 31 different factors of a companies fundamentals and operational strength. Here are some key insights as we drill into the specifics of these quality attributes.- RPM has a Quality Grade of B, ranking ahead of 78.28% of graded US stocks.
- RPM's asset turnover comes in at 1.025 -- ranking 14th of 89 Chemicals stocks.
- AVNT, CE, and ICL are the stocks whose asset turnover ratios are most correlated with RPM.
The table below shows RPM's key quality metrics over time.
Period | Asset Turnover | Gross Margin | ROIC |
---|---|---|---|
2021-08-31 | 1.025 | 0.385 | 0.132 |
2021-05-31 | 1.038 | 0.394 | 0.147 |
2021-02-28 | 1.016 | 0.389 | 0.136 |
2020-11-30 | 1.010 | 0.389 | 0.128 |
2020-08-31 | 1.004 | 0.385 | 0.115 |
2020-05-31 | 0.985 | 0.380 | 0.098 |
RPM Price Target
For more insight on analysts targets of RPM, see our RPM price target page. And for a list of of all stocks sorted by upside potential based on analyst target price, see our Top Price Target page.
Average Price Target | $95.23 | Average Broker Recommendation | 1.86 (Hold) |
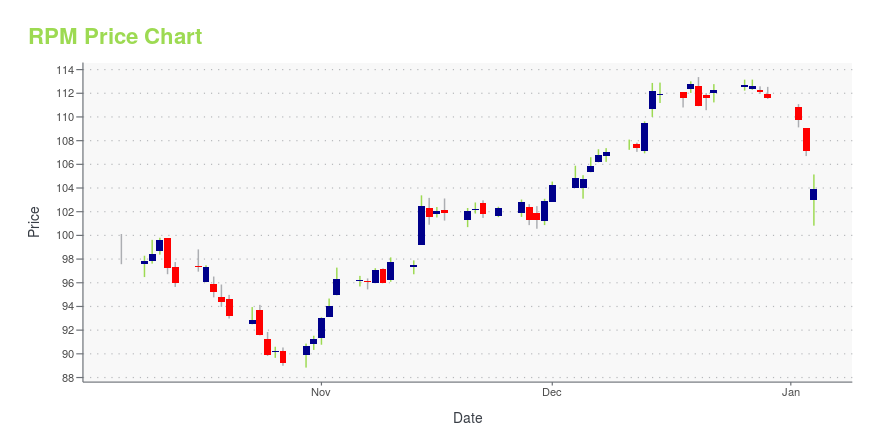
RPM Stock Price Chart Interactive Chart >
RPM Price/Volume Stats
Current price | $87.70 | 52-week high | $106.50 |
Prev. close | $87.99 | 52-week low | $74.56 |
Day low | $87.69 | Volume | 437,200 |
Day high | $89.62 | Avg. volume | 770,642 |
50-day MA | $96.25 | Dividend yield | 1.91% |
200-day MA | $89.99 | Market Cap | 11.32B |
RPM International Inc. (RPM) Company Bio
RPM International owns subsidiaries that are world leaders in specialty coatings, sealants, building materials and related services for both industrial and consumer markets. RPM's industrial products include roofing systems, sealants, corrosion control coatings, flooring coatings and specialty chemicals. The company was founded in 1947 and is based in Medina, Ohio.
Latest RPM News From Around the Web
Below are the latest news stories about RPM INTERNATIONAL INC that investors may wish to consider to help them evaluate RPM as an investment opportunity.
RPM Appoints Andrew G. Polanco as VP – Manufacturing and Announces Retirement of Gordon M. HydeMEDINA, Ohio, January 20, 2023--RPM APPOINTS ANDREW G. POLANCO AS VP – MANUFACTURING AND ANNOUNCES RETIREMENT OF GORDON M. HYDE |
Is Dividend King PPG Industries A Buy Before Earnings?PPG Industries reports later this week and may spark a decline in share prices. RPM International foreshadowed these results with a weak outlook of its own. The downturn in housing does not bode well for paint and chemical manufacturers. 5 stocks we like better than PPG Industries Shares of Dividend King PPG Industries (NYSE:PPG) are […] |
Can RPM International Inc.'s (NYSE:RPM) ROE Continue To Surpass The Industry Average?One of the best investments we can make is in our own knowledge and skill set. With that in mind, this article will... |
RPM International Inc. (NYSE:RPM) Q2 2023 Earnings Call TranscriptRPM International Inc. (NYSE:RPM) Q2 2023 Earnings Call Transcript January 5, 2023 RPM International Inc. reports earnings inline with expectations. Reported EPS is $1.1 EPS, expectations were $1.1. Operator: Good morning. And welcome to the RPM International’s Fiscal 2023 Second Quarter Earnings Conference Call. All participants will be in a listen-only mode. After today’s presentation, […] |
RPM International''s Return On Capital Employed InsightsPulled from Benzinga Pro data, RPM International (NYSE: RPM ) posted Q2 earnings of $131.54 million, an increase from Q1 of 22.29%. Sales dropped to $1.79 billion, a 7.25% decrease between quarters. RPM International earned $169.28 million, and sales totaled $1.93 billion in Q1. Why Is ROCE Significant? Earnings data without context is not clear and can be difficult to base trading decisions on. Return on Capital Employed (ROCE) helps to filter signal from noise by measuring yearly pre-tax profit relative to capital employed by a business. Generally, a higher ROCE suggests successful growth of a … Full story available on Benzinga.com |
RPM Price Returns
1-mo | -9.56% |
3-mo | -4.44% |
6-mo | -2.04% |
1-year | 0.88% |
3-year | 29.90% |
5-year | 86.58% |
YTD | -9.56% |
2022 | -1.71% |
2021 | 13.24% |
2020 | 20.57% |
2019 | 33.66% |
2018 | 14.83% |
RPM Dividends
Ex-Dividend Date | Type | Payout Amount | Change | ||||||
---|---|---|---|---|---|---|---|---|---|
Loading, please wait... |
Continue Researching RPM
Want to do more research on Rpm International Inc's stock and its price? Try the links below:Rpm International Inc (RPM) Stock Price | Nasdaq
Rpm International Inc (RPM) Stock Quote, History and News - Yahoo Finance
Rpm International Inc (RPM) Stock Price and Basic Information | MarketWatch
Loading social stream, please wait...