
RPT Realty (RPT): Price and Financial Metrics
RPT Price/Volume Stats
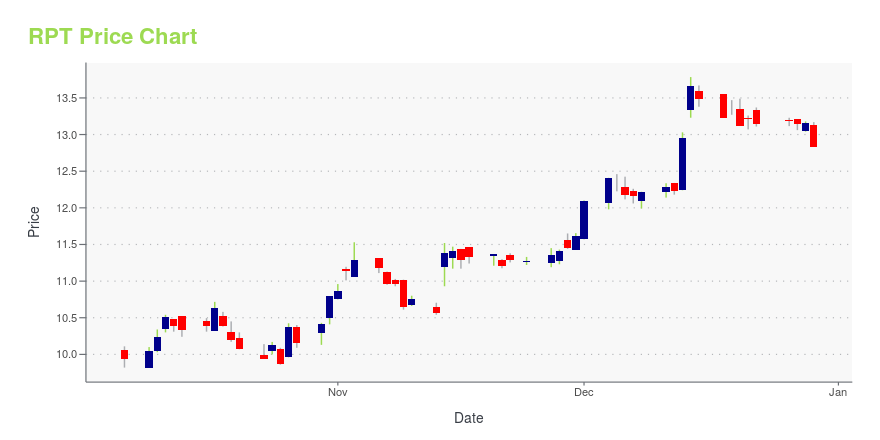
| Current price | $12.83 | 52-week high | $13.78 |
| Prev. close | $13.16 | 52-week low | $8.62 |
| Day low | $12.83 | Volume | 40,083,600 |
| Day high | $13.17 | Avg. volume | 916,668 |
| 50-day MA | $11.66 | Dividend yield | 4.36% |
| 200-day MA | $10.44 | Market Cap | 1.11B |
RPT Stock Price Chart Interactive Chart >
RPT Realty (RPT) Company Bio
Ramco-Gershenson Properties Trust engages in the ownership, development, acquisition, management, and leasing of community shopping centers, single tenant retail properties, and one regional mall in the Midwestern, Southeastern, and Mid-Atlantic regions of the United States. The company was founded in 1988 and is based in Farmington Hills, Michigan.
Latest RPT News From Around the Web
Below are the latest news stories about RPT REALTY that investors may wish to consider to help them evaluate RPT as an investment opportunity.
Livent Set to Join S&P MidCap 400; NCR Voyix and Rush Enterprises to Join S&P SmallCap 600S&P Dow Jones Indices will make the following changes to the S&P MidCap 400 and S&P SmallCap 600 effective prior to the open of trading on Tuesday, January 2: |
RPT Realty Shareholders Approve MergersNEW YORK, Dec. 12, 2023 (GLOBE NEWSWIRE) -- RPT Realty (NYSE:RPT) (“RPT” or the “Company”) announced today that, at a special meeting of the shareholders of RPT (the “Special Meeting”), the RPT shareholders approved the proposal necessary for the closing of the previously announced mergers pursuant to the Agreement and Plan of Merger, dated as of August 28, 2023 (the “Merger Agreement”), by and among Kimco Realty Corporation (“Kimco”), Kimco Realty OP, LLC, a Delaware limited liability company a |
RPT Realty Declares Special Cash Dividend of $0.05444 Per ShareNEW YORK, Nov. 13, 2023 (GLOBE NEWSWIRE) -- RPT Realty (NYSE:RPT) (“RPT” or the “Company”) announced today that its Board of Trustees declared a special dividend of $0.05444 per common share in connection with the previously announced definitive merger agreement entered into by and between the Company and Kimco Realty Corporation and the parties thereto. The special dividend is payable in cash on December 21, 2023, to shareholders of record on December 7, 2023. As a result of the payment of the |
RPT Realty Reports Q3 2023 Earnings: Net Loss of $7.9 Million, Operating FFO per Share at $0.24Same Property NOI Increases by 2.6% Year-Over-Year, Leasing Volume Exceeds 500,000 Square Feet for Fifth Consecutive Quarter |
RPT Realty Reports Third Quarter 2023 ResultsFinancial Highlights Net (loss) income attributable to common shareholders for the third quarter 2023 of $(7.9) million, or $(0.09) per diluted share, compared to $11.3 million, or $0.13 per diluted share for the same period in 2022. Third quarter 2023 Operating funds from operations ("FFO") per diluted share of $0.24. Same property net operating income ("NOI") during the third quarter 2023 increased 2.6% compared to the same period in 2022, exceeding internal quarterly expectations. Operational |
RPT Price Returns
| 1-mo | N/A |
| 3-mo | N/A |
| 6-mo | N/A |
| 1-year | 22.88% |
| 3-year | 14.80% |
| 5-year | 33.42% |
| YTD | 0.00% |
| 2023 | 35.25% |
| 2022 | -21.13% |
| 2021 | 59.44% |
| 2020 | -40.22% |
| 2019 | 34.71% |
RPT Dividends
| Ex-Dividend Date | Type | Payout Amount | Change | ||||||
|---|---|---|---|---|---|---|---|---|---|
| Loading, please wait... | |||||||||
Continue Researching RPT
Here are a few links from around the web to help you further your research on RPT Realty's stock as an investment opportunity:RPT Realty (RPT) Stock Price | Nasdaq
RPT Realty (RPT) Stock Quote, History and News - Yahoo Finance
RPT Realty (RPT) Stock Price and Basic Information | MarketWatch
Loading social stream, please wait...