Raytheon Technologies Corp. (RTX): Price and Financial Metrics

Raytheon Technologies Corp. (RTX): $97.53

0.08 (+0.08%)

POWR Rating

Component Grades

Momentum

B

Stability

C

Sentiment

Quality

C

Add RTX to Watchlist
Sign Up

Industry: Air/Defense Services

Industry

C

Ranked

#31 of 71

in industry

RTX Price/Volume Stats

Current price $97.53 52-week high $104.91
Prev. close $97.45 52-week low $68.56
Day low $97.47 Volume 10,700,900
Day high $98.08 Avg. volume 8,121,980
50-day MA $91.29 Dividend yield 2.47%
200-day MA $85.78 Market Cap 129.68B

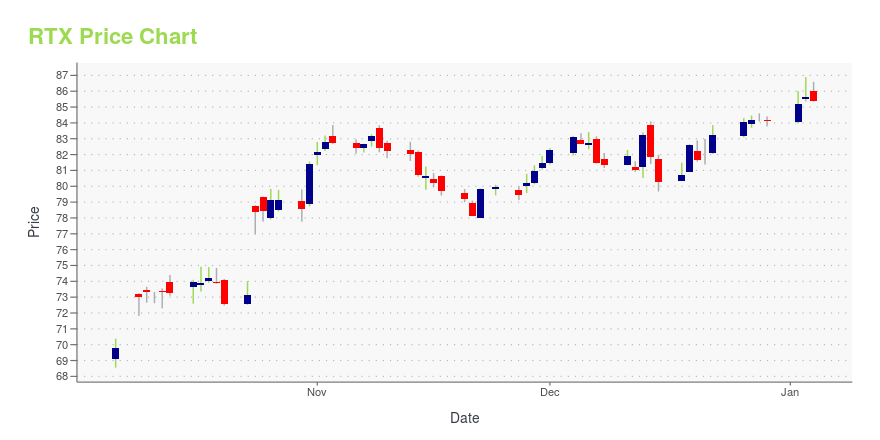
RTX Stock Price Chart Interactive Chart >

RTX POWR Grades

  • RTX scores best on the Momentum dimension, with a Momentum rank ahead of 81.12% of US stocks.
  • RTX's strongest trending metric is Stability; it's been moving down over the last 26 weeks.
  • RTX's current lowest rank is in the Sentiment metric (where it is better than 7.88% of US stocks).

RTX Stock Summary

  • RTX has a higher market value than 98.16% of US stocks; more precisely, its current market capitalization is $123,098,728,923.
  • RTX CORP's stock had its IPO on January 1, 1986, making it an older stock than 92.92% of US equities in our set.
  • With a price/earnings ratio of 38.58, RTX CORP P/E ratio is greater than that of about 80.34% of stocks in our set with positive earnings.
  • If you're looking for stocks that are quantitatively similar to RTX CORP, a group of peers worth examining would be DE, IBM, ISRG, NOW, and INTU.
  • RTX's SEC filings can be seen here. And to visit RTX CORP's official web site, go to www.rtx.com.

RTX Valuation Summary

  • In comparison to the median Industrials stock, RTX's price/sales ratio is 14.29% lower, now standing at 1.8.
  • RTX's price/sales ratio has moved up 0.3 over the prior 243 months.

Below are key valuation metrics over time for RTX.

Stock Date P/S P/B P/E EV/EBIT
RTX 2023-12-29 1.8 1.7 37.9 31.5
RTX 2023-12-28 1.8 1.7 37.9 31.5
RTX 2023-12-27 1.8 1.7 37.9 31.5
RTX 2023-12-26 1.8 1.7 37.9 31.5
RTX 2023-12-22 1.8 1.7 37.5 31.3
RTX 2023-12-21 1.8 1.7 37.0 30.9

RTX Growth Metrics

    Its 5 year net income to common stockholders growth rate is now at -21.75%.
  • Its year over year net income to common stockholders growth rate is now at 256.35%.
  • The 2 year net income to common stockholders growth rate now stands at 2.12%.
RTX's revenue has moved down $9,817,000,000 over the prior 34 months.

The table below shows RTX's growth in key financial areas (numbers in millions of US dollars).

Date Revenue Operating Cash Flow Net Income to Common Stock
2022-12-31 67,074 7,168 5,197
2022-09-30 66,025 5,657 4,461
2022-06-30 65,287 6,808 4,467
2022-03-31 64,853 6,829 4,195
2021-12-31 64,388 7,071 3,864
2021-09-30 63,763 5,289 3,313

RTX's Quality Factors

The “Quality” component of the POWR Ratings focuses on 31 different factors of a companies fundamentals and operational strength. Here are some key insights as we drill into the specifics of these quality attributes.
  • RTX has a Quality Grade of C, ranking ahead of 43.59% of graded US stocks.
  • RTX's asset turnover comes in at 0.398 -- ranking 16th of 21 Aircraft stocks.
  • SPR, HON, and DCO are the stocks whose asset turnover ratios are most correlated with RTX.

The table below shows RTX's key quality metrics over time.

Period Asset Turnover Gross Margin ROIC
2021-09-30 0.398 0.176 0.094
2021-06-30 0.387 0.158 0.076
2021-03-31 0.374 0.140 -0.018
2020-12-31 0.362 0.151 -0.026
2020-09-30 0.441 0.198 0.005
2020-06-30 0.492 0.235 0.033

RTX Price Target

For more insight on analysts targets of RTX, see our RTX price target page. And for a list of of all stocks sorted by upside potential based on analyst target price, see our Top Price Target page.

Average Price Target $101.61 Average Broker Recommendation 1.45 (Moderate Buy)

Raytheon Technologies Corp. (RTX) Company Bio


Raytheon Technologies Corporation is an American multinational aerospace and defense conglomerate headquartered in Waltham, Massachusetts. It is one of the largest aerospace, intelligence services providers, and defense manufacturers in the world by revenue and market capitalization. Raytheon Technologies (RTX) researches, develops, and manufactures advanced technology products in the aerospace and defense industry, including aircraft enginesavionicsaerostructurescybersecurityguided missilesair defense systemssatellites, and drones. The company is also a large military contractor, getting a significant portion of its revenue from the U.S. government.(Source:Wikipedia)


RTX Latest News Stream


Event/Time News Detail
Loading, please wait...

RTX Latest Social Stream


Loading social stream, please wait...

View Full RTX Social Stream

Latest RTX News From Around the Web

Below are the latest news stories about RTX CORP that investors may wish to consider to help them evaluate RTX as an investment opportunity.

Top 3 Industrial Stock Picks for the New Year

The industrial economy is set to rebound in the coming months, lining up with these industrial stock picks will put the odds in your favor.

Gabriel Osorio-Mazzilli on InvestorPlace | December 31, 2023

The Smart Money: 3 Stocks the ‘Super Investors’ Are Buying

When the smart money is piling into a stock, it pays to sit up, take notice, and start doing your own due diligence.

Rich Duprey on InvestorPlace | December 26, 2023

20 Largest Air Forces in the World Heading into 2024

In this article, we look at the 20 largest air forces in the world. You can skip our detailed analysis on the aircraft fleet size of various air forces and trends in the aerospace industry by heading over directly to the 5 Largest Air Forces in the World Heading into 2024. Air Forces around the […]

Yahoo | December 23, 2023

Japan to Send U.S. Patriot Missiles, Creating Deeper Pool for Ukraine Air Defenses

The decision is a landmark for Japan, which has had a self-imposed ban on weapons exports for decades as a legacy of its desire to stay out of global conflicts following World War II.

Yahoo | December 22, 2023

Is RTX an Excellent Dividend Stock to Buy for 2024?

Passive-income investors might look to dividend stocks more in 2024 as government bond yields have decreased.

Yahoo | December 21, 2023

Read More 'RTX' Stories Here

RTX Price Returns

1-mo 8.46%
3-mo 16.68%
6-mo 37.41%
1-year 2.90%
3-year 34.88%
5-year 45.22%
YTD 16.68%
2023 -14.44%
2022 20.01%
2021 23.27%
2020 -16.75%
2019 43.82%

RTX Dividends

Ex-Dividend Date Type Payout Amount Change
Loading, please wait...
View Full RTX Dividend History

Get Free Updates

Join thousands of investors who get the latest news, insights and top rated picks from StockNews.com!