Raytheon Technologies Corp. (RTX): Price and Financial Metrics
GET POWR RATINGS... FREE!
RTX POWR Grades
- Stability is the dimension where RTX ranks best; there it ranks ahead of 91.57% of US stocks.
- The strongest trend for RTX is in Stability, which has been heading up over the past 178 days.
- RTX's current lowest rank is in the Value metric (where it is better than 53.32% of US stocks).
RTX Stock Summary
- RAYTHEON TECHNOLOGIES CORP's market capitalization of $140,269,401,418 is ahead of 98.7% of US-listed equities.
- RTX's went public 37.24 years ago, making it older than 93.42% of listed US stocks we're tracking.
- In terms of volatility of its share price, RTX is more volatile than just 7.81% of stocks we're observing.
- Stocks with similar financial metrics, market capitalization, and price volatility to RAYTHEON TECHNOLOGIES CORP are SNY, DE, ADBE, NFLX, and NVS.
- RTX's SEC filings can be seen here. And to visit RAYTHEON TECHNOLOGIES CORP's official web site, go to www.rtx.com.
RTX Valuation Summary
- In comparison to the median Industrials stock, RTX's price/sales ratio is 16.67% higher, now standing at 2.1.
- RTX's price/sales ratio has moved up 1.1 over the prior 243 months.
Below are key valuation metrics over time for RTX.
Stock | Date | P/S | P/B | P/E | EV/EBIT |
---|---|---|---|---|---|
RTX | 2023-03-17 | 2.1 | 1.9 | 27.0 | 23.4 |
RTX | 2023-03-16 | 2.1 | 2.0 | 27.6 | 23.8 |
RTX | 2023-03-15 | 2.1 | 1.9 | 27.0 | 23.4 |
RTX | 2023-03-14 | 2.1 | 2.0 | 27.7 | 23.9 |
RTX | 2023-03-13 | 2.1 | 2.0 | 27.5 | 23.7 |
RTX | 2023-03-10 | 2.1 | 1.9 | 27.1 | 23.4 |
RTX Growth Metrics
- Its 5 year net income to common stockholders growth rate is now at -21.75%.
- Its year over year net income to common stockholders growth rate is now at 256.35%.
- The 2 year net income to common stockholders growth rate now stands at 2.12%.

The table below shows RTX's growth in key financial areas (numbers in millions of US dollars).
Date | Revenue | Operating Cash Flow | Net Income to Common Stock |
---|---|---|---|
2022-12-31 | 67,074 | 7,168 | 5,197 |
2022-09-30 | 66,025 | 5,657 | 4,461 |
2022-06-30 | 65,287 | 6,808 | 4,467 |
2022-03-31 | 64,853 | 6,829 | 4,195 |
2021-12-31 | 64,388 | 7,071 | 3,864 |
2021-09-30 | 63,763 | 5,289 | 3,313 |
RTX's Quality Factors
The “Quality” component of the POWR Ratings focuses on 31 different factors of a companies fundamentals and operational strength. Here are some key insights as we drill into the specifics of these quality attributes.- RTX has a Quality Grade of C, ranking ahead of 43.59% of graded US stocks.
- RTX's asset turnover comes in at 0.398 -- ranking 16th of 21 Aircraft stocks.
- SPR, HON, and DCO are the stocks whose asset turnover ratios are most correlated with RTX.
The table below shows RTX's key quality metrics over time.
Period | Asset Turnover | Gross Margin | ROIC |
---|---|---|---|
2021-09-30 | 0.398 | 0.176 | 0.094 |
2021-06-30 | 0.387 | 0.158 | 0.076 |
2021-03-31 | 0.374 | 0.140 | -0.018 |
2020-12-31 | 0.362 | 0.151 | -0.026 |
2020-09-30 | 0.441 | 0.198 | 0.005 |
2020-06-30 | 0.492 | 0.235 | 0.033 |
RTX Price Target
For more insight on analysts targets of RTX, see our RTX price target page. And for a list of of all stocks sorted by upside potential based on analyst target price, see our Top Price Target page.
Average Price Target | $101.61 | Average Broker Recommendation | 1.45 (Moderate Buy) |
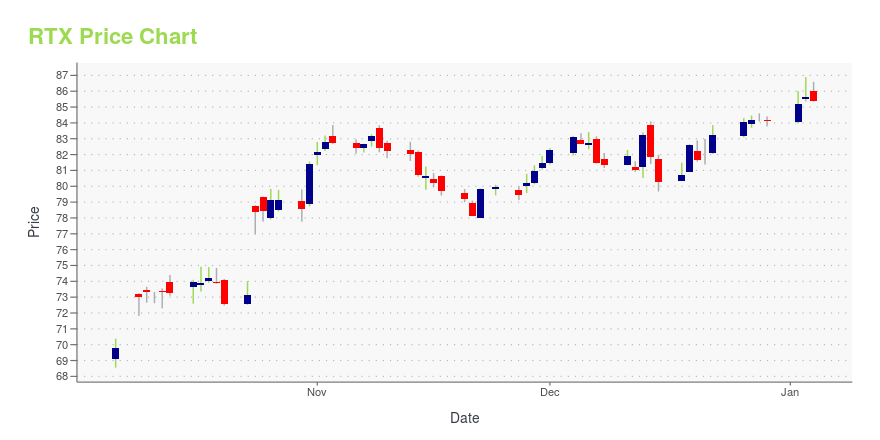
RTX Stock Price Chart Interactive Chart >
RTX Price/Volume Stats
Current price | $97.53 | 52-week high | $108.84 |
Prev. close | $95.75 | 52-week low | $80.27 |
Day low | $96.31 | Volume | 3,972,704 |
Day high | $97.81 | Avg. volume | 4,915,336 |
50-day MA | $98.62 | Dividend yield | 2.24% |
200-day MA | $94.19 | Market Cap | 142.71B |
Raytheon Technologies Corp. (RTX) Company Bio
Raytheon Technologies Corporation is an American multinational aerospace and defense conglomerate headquartered in Waltham, Massachusetts. It is one of the largest aerospace, intelligence services providers, and defense manufacturers in the world by revenue and market capitalization. Raytheon Technologies (RTX) researches, develops, and manufactures advanced technology products in the aerospace and defense industry, including aircraft engines, avionics, aerostructures, cybersecurity, guided missiles, air defense systems, satellites, and drones. The company is also a large military contractor, getting a significant portion of its revenue from the U.S. government.(Source:Wikipedia)
Latest RTX News From Around the Web
Below are the latest news stories about RAYTHEON TECHNOLOGIES CORP that investors may wish to consider to help them evaluate RTX as an investment opportunity.
The 7 Best Defense Stocks to Buy for Our Dangerous WorldBuy defence stocks as governments are committed to military investments to protect their respective countries. |
Raytheon (RTX) Secures Deal to Provide CETS for Combat JetsRaytheon (RTX) is set to offer CETS personnel, who will work with Air Force military and civilian personnel to become self-sufficient in the maintenance of aircraft systems. |
Northrop (NOC) Arm Wins $57.4M Deal to Support MQ-4C TritonNorthrop's (NOC) business unit, Northrop Grumman Systems Corp., wins a $57.4-million deal to support MQ-4C Triton air vehicles. |
Raytheon Technologies Shows Rising Price Performance, Jumps To 81 RS RatingRaytheon Technologies shows improving price performance, earning an upgrade to its IBD Relative Strength Rating from 78 to 81. |
Investing in Raytheon Technologies (NYSE:RTX) three years ago would have delivered you a 127% gainLow-cost index funds make it easy to achieve average market returns. But across the board there are plenty of stocks... |
RTX Price Returns
1-mo | -3.39% |
3-mo | -0.12% |
6-mo | 16.98% |
1-year | 2.35% |
3-year | 116.14% |
5-year | 46.74% |
YTD | -2.83% |
2022 | 20.01% |
2021 | 23.27% |
2020 | -16.75% |
2019 | 43.82% |
2018 | -14.66% |
RTX Dividends
Ex-Dividend Date | Type | Payout Amount | Change | ||||||
---|---|---|---|---|---|---|---|---|---|
Loading, please wait... |
Loading social stream, please wait...