Rush Enterprises, Inc. - (RUSHA): Price and Financial Metrics

Rush Enterprises, Inc. - (RUSHA): $55.41

3.24 (+6.21%)

POWR Rating

Component Grades

Momentum

C

Stability

C

Sentiment

Quality

C

Add RUSHA to Watchlist
Sign Up

Industry: Auto Dealers & Rentals

Industry

B

Ranked

#5 of 21

in industry

RUSHA Price/Volume Stats
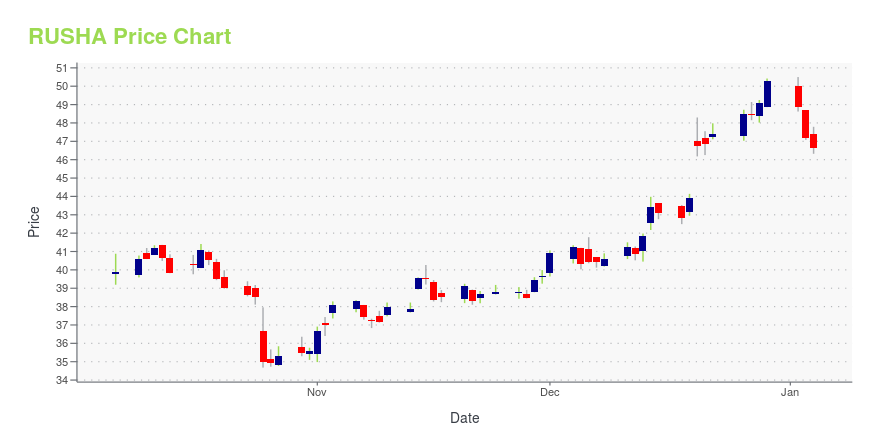
Current price $55.41 52-week high $62.20
Prev. close $52.17 52-week low $42.72
Day low $52.26 Volume 163,725
Day high $55.56 Avg. volume 186,859
50-day MA $53.11 Dividend yield 1.57%
200-day MA $51.47 Market Cap 3.01B

RUSHA Stock Price Chart Interactive Chart >

RUSHA POWR Grades

  • Sentiment is the dimension where RUSHA ranks best; there it ranks ahead of 88.83% of US stocks.
  • RUSHA's strongest trending metric is Value; it's been moving up over the last 179 days.
  • RUSHA's current lowest rank is in the Quality metric (where it is better than 53.7% of US stocks).

RUSHA Stock Summary

  • RUSH ENTERPRISES INC's capital turnover -- a measure of revenue relative to shareholder's equity -- is better than 87.87% of US listed stocks.
  • RUSHA's price/sales ratio is 0.38; that's higher than the P/S ratio of just 13.8% of US stocks.
  • In terms of volatility of its share price, RUSHA is more volatile than merely 12.31% of stocks we're observing.
  • If you're looking for stocks that are quantitatively similar to RUSH ENTERPRISES INC, a group of peers worth examining would be SCS, STC, PGTI, ODP, and GPI.
  • Visit RUSHA's SEC page to see the company's official filings. To visit the company's web site, go to www.rushenterprises.com.

RUSHA Valuation Summary

  • RUSHA's price/sales ratio is 0.4; this is 50% lower than that of the median Consumer Cyclical stock.
  • RUSHA's EV/EBIT ratio has moved down 18.5 over the prior 239 months.

Below are key valuation metrics over time for RUSHA.

Stock Date P/S P/B P/E EV/EBIT
RUSHA 2023-05-19 0.4 1.6 7.4 7.7
RUSHA 2023-05-18 0.4 1.6 7.5 7.8
RUSHA 2023-05-17 0.4 1.6 7.4 7.8
RUSHA 2023-05-16 0.4 1.6 7.4 7.7
RUSHA 2023-05-15 0.4 1.6 7.4 7.7
RUSHA 2023-05-12 0.4 1.6 7.3 7.7

RUSHA Growth Metrics

    Its 5 year revenue growth rate is now at 37.24%.
  • Its year over year cash and equivalents growth rate is now at -33.71%.
  • The 2 year revenue growth rate now stands at -5.06%.
Over the past 34 months, RUSHA's revenue has gone up $1,353,477,000.

The table below shows RUSHA's growth in key financial areas (numbers in millions of US dollars).

Date Revenue Operating Cash Flow Net Income to Common Stock
2022-12-31 7,101.67 294.4 391.382
2022-09-30 6,530.529 167.02 361.695
2022-06-30 5,932.764 242.822 340.718
2022-03-31 5,457.538 416.79 288.535
2021-12-31 5,126.142 422.346 241.415
2021-09-30 5,082.539 611.158 213.801

RUSHA's Quality Factors

The “Quality” component of the POWR Ratings focuses on 31 different factors of a companies fundamentals and operational strength. Here are some key insights as we drill into the specifics of these quality attributes.
  • RUSHA has a Quality Grade of B, ranking ahead of 79.9% of graded US stocks.
  • RUSHA's asset turnover comes in at 1.677 -- ranking 64th of 165 Retail stocks.
  • SBH, DDS, and CRMT are the stocks whose asset turnover ratios are most correlated with RUSHA.

The table below shows RUSHA's key quality metrics over time.

Period Asset Turnover Gross Margin ROIC
2021-06-30 1.677 0.193 0.089
2021-03-31 1.551 0.189 0.068
2020-12-31 1.540 0.185 0.057
2020-09-30 1.504 0.183 0.049
2020-06-30 1.587 0.178 0.052
2020-03-31 1.692 0.175 0.061

RUSHA Price Target

For more insight on analysts targets of RUSHA, see our RUSHA price target page. And for a list of of all stocks sorted by upside potential based on analyst target price, see our Top Price Target page.

Average Price Target $59.00 Average Broker Recommendation 1.5 (Moderate Buy)

Rush Enterprises, Inc. - (RUSHA) Company Bio


Rush Enterprises operates as an integrated retailer of commercial vehicles and related services in the United States. The company was founded in 1965 and is based in New Braunfels, Texas.


RUSHA Latest News Stream


Event/Time News Detail
Loading, please wait...

RUSHA Latest Social Stream


Loading social stream, please wait...

View Full RUSHA Social Stream

Latest RUSHA News From Around the Web

Below are the latest news stories about RUSH ENTERPRISES INC that investors may wish to consider to help them evaluate RUSHA as an investment opportunity.

Investing in Rush Enterprises (NASDAQ:RUSH.B) three years ago would have delivered you a 156% gain

The most you can lose on any stock (assuming you don't use leverage) is 100% of your money. But in contrast you can...

Yahoo | May 18, 2023

Are Investors Undervaluing Group 1 Automotive (GPI) Right Now?

Here at Zacks, our focus is on the proven Zacks Rank system, which emphasizes earnings estimates and estimate revisions to find great stocks. Nevertheless, we are always paying attention to the latest value, growth, and momentum trends to underscore strong picks.

Yahoo | May 9, 2023

Rush Enterprises (NASDAQ:RUSH.B) Could Be A Buy For Its Upcoming Dividend

Rush Enterprises, Inc. ( NASDAQ:RUSH.B ) stock is about to trade ex-dividend in 4 days. Typically, the ex-dividend date...

Yahoo | May 4, 2023

Rush Enterprises, Inc. Reports First Quarter 2023 Results, Announces $0.21 per Share Dividend

Revenues of $1.9 billion, net income of $90.5 millionEarnings per diluted share of $1.60Absorption ratio 136.5%Strong revenues and profitability due to pent-up demand for new commercial vehiclesAftermarket revenue growth significantly outpaced the industry with focus on national accounts and increase in mobile service capabilitiesBoard declares cash dividend of $0.21 per share of Class A and Class B common stock SAN ANTONIO, April 25, 2023 (GLOBE NEWSWIRE) -- Rush Enterprises, Inc. (NASDAQ: RUSH

Yahoo | April 25, 2023

Is AutoNation (AN) Stock Undervalued Right Now?

Here at Zacks, our focus is on the proven Zacks Rank system, which emphasizes earnings estimates and estimate revisions to find great stocks. Nevertheless, we are always paying attention to the latest value, growth, and momentum trends to underscore strong picks.

Yahoo | April 20, 2023

Read More 'RUSHA' Stories Here

RUSHA Price Returns

1-mo 7.49%
3-mo -3.74%
6-mo 6.98%
1-year 6.98%
3-year 109.48%
5-year 105.59%
YTD 6.82%
2022 -4.51%
2021 36.44%
2020 35.24%
2019 36.49%
2018 -31.74%

RUSHA Dividends

Ex-Dividend Date Type Payout Amount Change
Loading, please wait...
View Full RUSHA Dividend History

Continue Researching RUSHA

Here are a few links from around the web to help you further your research on Rush Enterprises Inc's stock as an investment opportunity:

Rush Enterprises Inc (RUSHA) Stock Price | Nasdaq
Rush Enterprises Inc (RUSHA) Stock Quote, History and News - Yahoo Finance
Rush Enterprises Inc (RUSHA) Stock Price and Basic Information | MarketWatch

Get Free Updates

Join thousands of investors who get the latest news, insights and top rated picks from StockNews.com!