
Retail Value Inc. (RVI): Price and Financial Metrics
RVI Price/Volume Stats
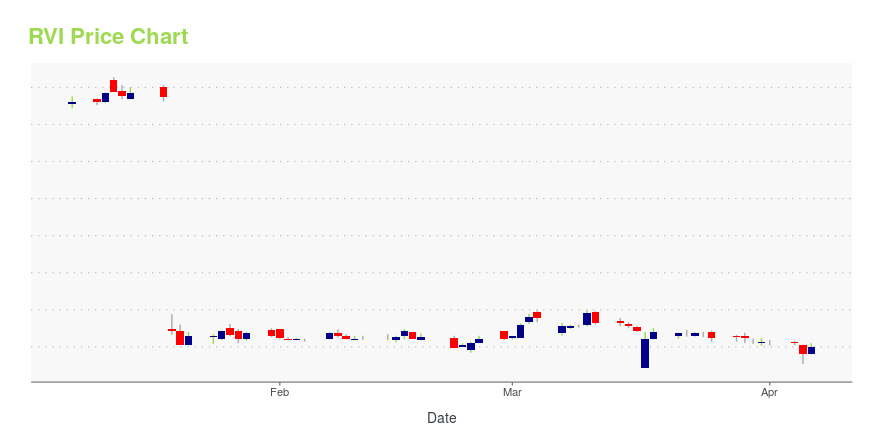
| Current price | $3.00 | 52-week high | $6.84 |
| Prev. close | $2.90 | 52-week low | $2.72 |
| Day low | $2.90 | Volume | 5,445,100 |
| Day high | $3.05 | Avg. volume | 348,036 |
| 50-day MA | $3.16 | Dividend yield | 734.67% |
| 200-day MA | $5.26 | Market Cap | 63.35M |
RVI Stock Price Chart Interactive Chart >
Retail Value Inc. (RVI) Company Bio
Retail Value Inc. is a portfolio Of 50 assets of DDR Corp., comprised of 38 Continental U.S. assets and the entirety of the Puerto Rico portfolio which provides real estate investment services. The business is located in the United States.
Latest RVI News From Around the Web
Below are the latest news stories about Retail Value Inc that investors may wish to consider to help them evaluate RVI as an investment opportunity.
SITE Centers Corp. -- Moody's announces completion of a periodic review of ratings of SITE Centers Corp.Announcement of Periodic Review: Moody's announces completion of a periodic review of ratings of SITE Centers Corp.Global Credit Research - 15 Feb 2022New York, February 15, 2022 -- Moody's Investors Service ("Moody's") has completed a periodic review of the ratings of SITE Centers Corp. and other ratings that are associated with the same analytical unit. The review was conducted through a portfolio review discussion held on 14 February 2022 in which Moody's reassessed the appropriateness of the ratings in the context of the relevant principal methodology(ies), recent developments, and a comparison of the financial and operating profile to similarly rated peers. Since 1 January 2019, Moody's practice has been to issue a press release following each periodic review to announce its comp... |
Cambria Investment Management, L.P. Buys iShares Global Financials ETF, iShares Global Energy ...Investment company Cambria Investment Management, L.P. (Current Portfolio) buys iShares Global Financials ETF, iShares Global Energy ETF, Invesco DB Agriculture Fund, Macy's Inc, Matson Inc, sells Cambria Emerging Shareholder Yield ETF, iShares Global Materials ETF, Murphy Oil Corp, Domtar Corp, Cambria Global Value ETF during the 3-months ended 2021Q4, according to the most recent filings of the investment company, Cambria Investment Management, L.P.. |
Transcend Wealth Collective, Llc Buys Alerian MLP ETF, ITT Inc, iShares Interest Rate Hedged ...Investment company Transcend Wealth Collective, Llc (Current Portfolio) buys Alerian MLP ETF, ITT Inc, iShares Interest Rate Hedged Corporate Bond ETF, Intel Corp, iShares Global Consumer Staples ETF, sells Intercontinental Exchange Inc, Quadratic Interest Rate Volatility And Inflation H, iShares MSCI All Country Asia ex Japan Index Fund, iShares Latin America 40 ETF, Peloton Interactive Inc during the 3-months ended 2021Q4, according to the most recent filings of the investment company, Transce |
Today’s Biggest Pre-Market Stock Movers: 10 Top Gainers and Losers on WednesdayGood morning, investor! |
Retail Value Inc. Announces Tax Allocations of 2021 DistributionsBEACHWOOD, Ohio, January 19, 2022--Retail Value Inc. Announces Tax Allocations of 2021 Distributions |
RVI Price Returns
| 1-mo | N/A |
| 3-mo | N/A |
| 6-mo | N/A |
| 1-year | N/A |
| 3-year | 4.11% |
| 5-year | -19.50% |
| YTD | N/A |
| 2023 | N/A |
| 2022 | 0.00% |
| 2021 | 81.33% |
| 2020 | -56.30% |
| 2019 | 51.93% |
RVI Dividends
| Ex-Dividend Date | Type | Payout Amount | Change | ||||||
|---|---|---|---|---|---|---|---|---|---|
| Loading, please wait... | |||||||||
Continue Researching RVI
Want to see what other sources are saying about Retail Value Inc's financials and stock price? Try the links below:Retail Value Inc (RVI) Stock Price | Nasdaq
Retail Value Inc (RVI) Stock Quote, History and News - Yahoo Finance
Retail Value Inc (RVI) Stock Price and Basic Information | MarketWatch
Loading social stream, please wait...