
Riverview Bancorp Inc (RVSB): Price and Financial Metrics
RVSB Price/Volume Stats
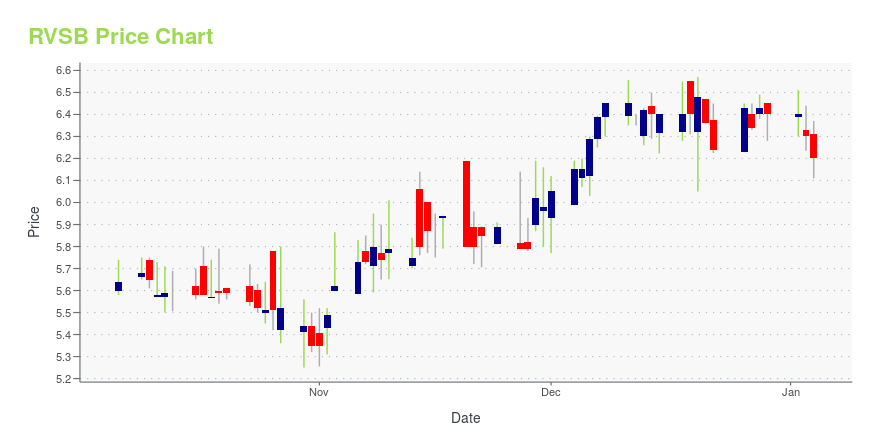
| Current price | $4.60 | 52-week high | $6.57 |
| Prev. close | $4.40 | 52-week low | $3.30 |
| Day low | $4.45 | Volume | 14,106 |
| Day high | $4.60 | Avg. volume | 28,341 |
| 50-day MA | $4.00 | Dividend yield | 1.81% |
| 200-day MA | $4.96 | Market Cap | 97.11M |
RVSB Stock Price Chart Interactive Chart >
Riverview Bancorp Inc (RVSB) Company Bio
Riverview Bancorp, Inc. operates as the holding company for Riverview Community Bank that provides community banking services in the Portland-Vancouver area of Washington. The company was founded in 1923 and is based in Vancouver, Washington.
Latest RVSB News From Around the Web
Below are the latest news stories about RIVERVIEW BANCORP INC that investors may wish to consider to help them evaluate RVSB as an investment opportunity.
Riverview Bancorp Declares Quarterly Cash Dividend of $0.06 Per ShareVANCOUVER, Wash., Dec. 26, 2023 (GLOBE NEWSWIRE) -- Riverview Bancorp, Inc. (Nasdaq GSM: RVSB) (“Riverview” or the “Company”) today announced that on December 20, 2023, its Board of Directors approved a quarterly cash dividend to $0.06 per share, which remained unchanged compared to the preceding quarter. The dividend will be payable January 16, 2024, to shareholders of record on January 5, 2024. Based on the current share price, the annualized dividend yield is 3.84%. About Riverview Riverview |
Riverview Bancorp, Inc. (NASDAQ:RVSB) has caught the attention of institutional investors who hold a sizeable 49% stakeKey Insights Institutions' substantial holdings in Riverview Bancorp implies that they have significant influence over... |
Riverview Bancorp (NASDAQ:RVSB) shareholders have endured a 26% loss from investing in the stock five years agoIn order to justify the effort of selecting individual stocks, it's worth striving to beat the returns from a market... |
Riverview Bancorp (RVSB) Meets Q2 Earnings EstimatesRiverview Bancorp (RVSB) delivered earnings and revenue surprises of 0% and 1.79%, respectively, for the quarter ended September 2023. Do the numbers hold clues to what lies ahead for the stock? |
Riverview Bancorp Earns $2.5 Million in Second Fiscal Quarter 2024VANCOUVER, Wash., Oct. 26, 2023 (GLOBE NEWSWIRE) -- Riverview Bancorp, Inc. (Nasdaq GSM: RVSB) (“Riverview” or the “Company”) today reported earnings of $2.5 million, or $0.12 per diluted share, in the second fiscal quarter ended September 30, 2023, compared to $2.8 million, or $0.13 per diluted share, in the first fiscal quarter ended June 30, 2023, and $5.2 million, or $0.24 per diluted share, in the second fiscal quarter a year ago. In the first six months of fiscal 2024, net income was $5.3 |
RVSB Price Returns
| 1-mo | 18.58% |
| 3-mo | 3.92% |
| 6-mo | -19.22% |
| 1-year | -13.55% |
| 3-year | -26.64% |
| 5-year | -35.63% |
| YTD | -26.09% |
| 2023 | -13.14% |
| 2022 | 3.24% |
| 2021 | 50.86% |
| 2020 | -33.53% |
| 2019 | 15.32% |
RVSB Dividends
| Ex-Dividend Date | Type | Payout Amount | Change | ||||||
|---|---|---|---|---|---|---|---|---|---|
| Loading, please wait... | |||||||||
Continue Researching RVSB
Want to see what other sources are saying about Riverview Bancorp Inc's financials and stock price? Try the links below:Riverview Bancorp Inc (RVSB) Stock Price | Nasdaq
Riverview Bancorp Inc (RVSB) Stock Quote, History and News - Yahoo Finance
Riverview Bancorp Inc (RVSB) Stock Price and Basic Information | MarketWatch
Loading social stream, please wait...