
Sachem Capital Corp. Common Shares (SACH): Price and Financial Metrics
SACH Price/Volume Stats
| Current price | $2.63 | 52-week high | $4.64 |
| Prev. close | $2.70 | 52-week low | $2.22 |
| Day low | $2.60 | Volume | 269,800 |
| Day high | $2.70 | Avg. volume | 334,125 |
| 50-day MA | $2.51 | Dividend yield | 12.21% |
| 200-day MA | $3.22 | Market Cap | 124.78M |
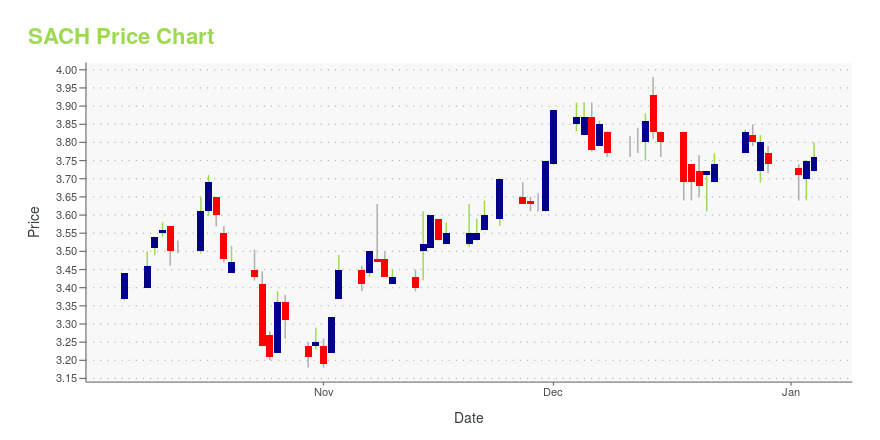
SACH Stock Price Chart Interactive Chart >
Sachem Capital Corp. Common Shares (SACH) Company Bio
Sachem Capital Corporation is a REIT that specializes in originating, underwriting, funding, servicing, and managing a portfolio of short-term loans secured by first mortgage liens primarily in Connecticut.
Latest SACH News From Around the Web
Below are the latest news stories about SACHEM CAPITAL CORP that investors may wish to consider to help them evaluate SACH as an investment opportunity.
Sachem Capital Corp. Announces Dividend of $0.11 per ShareBRANFORD, Conn., Dec. 14, 2023 (GLOBE NEWSWIRE) -- Sachem Capital Corp. (NYSE American: SACH) announced today that its board of directors authorized and declared a quarterly dividend of $0.11 per share to be paid to shareholders of record as of the close of trading on the NYSE American on December, 29, 2023. The dividend is payable on January 10, 2024. About Sachem Capital Corp.Sachem Capital Corp. is a mortgage REIT that specializes in originating, underwriting, funding, servicing, and managing |
Sachem Capital Corp. (AMEX:SACH) Q3 2023 Earnings Call TranscriptSachem Capital Corp. (AMEX:SACH) Q3 2023 Earnings Call Transcript November 14, 2023 Operator: Good day and welcome to the Sachem Capital Third Quarter 2023 Earnings Conference Call. All participants will be in listen-only mode. [Operator Instructions] After today’s presentation, there will be opportunity to ask questions. Please note that this event is being recorded. I’d […] |
Q3 2023 Sachem Capital Corp Earnings CallQ3 2023 Sachem Capital Corp Earnings Call |
Sachem Capital Reports Third Quarter 2023 Results – Produces Revenue Growth of 29.5% to $17.5 MillionCompany to Host Webcast and Conference CallBRANFORD, Conn., Nov. 13, 2023 (GLOBE NEWSWIRE) -- Sachem Capital Corp. (NYSE American: SACH) announced its financial results for the third quarter ended September 30, 2023. John Villano, CPA, Sachem Capital’s Chief Executive Officer, stated, “Once again we demonstrated our ability to grow revenue and profits during a very difficult macroeconomic backdrop. Our enhanced focus on deliberate underwriting, our conservative approach to balance sheet leverage |
Sachem Capital Sets Dates For Third Quarter 2023 Earnings Release And Conference CallBRANFORD, Conn., Nov. 08, 2023 (GLOBE NEWSWIRE) -- Sachem Capital Corp. (NYSE American: SACH) (the “Company”) announced today that the Company will release its third quarter 2023 financial results after market close on Monday, November 13, 2023. A webcast and conference call to discuss the results will be held on Tuesday, November 14, 2023, at 8:00 a.m. Eastern Standard Time. Webcast:A webcast of the conference call will be available on the Investors section of the Company’s website www.sachemca |
SACH Price Returns
| 1-mo | 14.35% |
| 3-mo | 1.86% |
| 6-mo | -37.90% |
| 1-year | -17.08% |
| 3-year | -27.59% |
| 5-year | -3.53% |
| YTD | -25.28% |
| 2023 | 29.48% |
| 2022 | -35.83% |
| 2021 | 52.67% |
| 2020 | 7.94% |
| 2019 | 19.38% |
SACH Dividends
| Ex-Dividend Date | Type | Payout Amount | Change | ||||||
|---|---|---|---|---|---|---|---|---|---|
| Loading, please wait... | |||||||||
Continue Researching SACH
Want to do more research on Sachem Capital Corp's stock and its price? Try the links below:Sachem Capital Corp (SACH) Stock Price | Nasdaq
Sachem Capital Corp (SACH) Stock Quote, History and News - Yahoo Finance
Sachem Capital Corp (SACH) Stock Price and Basic Information | MarketWatch
Loading social stream, please wait...