
Safehold Inc. (SAFE): Price and Financial Metrics
SAFE Price/Volume Stats
| Current price | $22.78 | 52-week high | $25.52 |
| Prev. close | $22.26 | 52-week low | $15.00 |
| Day low | $22.24 | Volume | 192,912 |
| Day high | $22.95 | Avg. volume | 341,059 |
| 50-day MA | $19.82 | Dividend yield | 3.14% |
| 200-day MA | $19.81 | Market Cap | 1.63B |
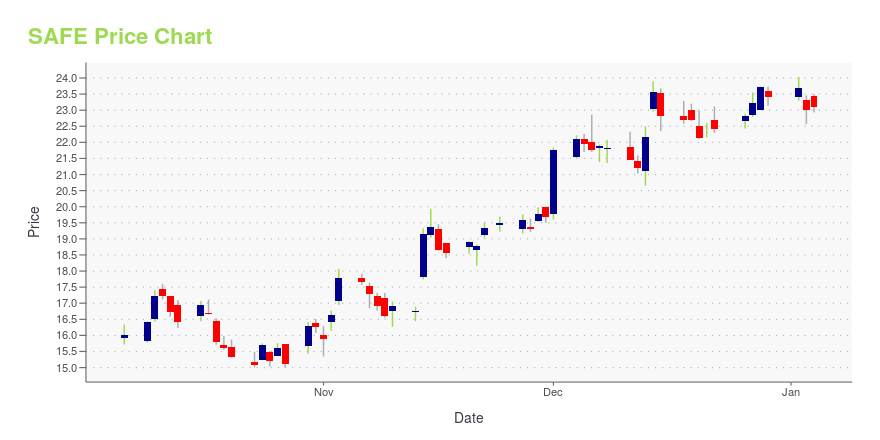
SAFE Stock Price Chart Interactive Chart >
Safehold Inc. (SAFE) Company Bio
New York-based Safety, Income and Growth was founded in 2017 with the objective of acquiring, owning, managing, financing and capitalizing on ground net leases. GNLs involves leasing land, typically for a long period of time (ranging from 30 to 99 years), to a tenant for the purpose of building real estate on the property and are most often "triple net" leases, which means the tenant is responsible for costs including: development costs, capital expenditures and all property operating expenses.
Latest SAFE News From Around the Web
Below are the latest news stories about SAFEHOLD INC that investors may wish to consider to help them evaluate SAFE as an investment opportunity.
Safehold Declares Fourth Quarter 2023 Common Stock DividendSafehold Inc. (NYSE: SAFE) announced today that the Company's Board of Directors has declared common stock dividends of $0.177 per share for the fourth quarter of 2023. The dividend represents an annualized rate of $0.708 per share and is payable on January 16, 2024 to holders of record on December 29, 2023. |
Safehold to Present at Goldman Sachs Financial Services ConferenceSafehold Inc. (NYSE: SAFE) announced today that Jay Sugarman, Chairman and Chief Executive Officer, will present at the Goldman Sachs Financial Services Conference on Wednesday, December 6, 2023 at 2:20pm ET. |
Safehold Closes Ground Lease for Affordable Housing Development in Santa Clara, CaliforniaSafehold, Inc. (NYSE: SAFE), the creator and leader of the modern ground lease industry, has closed on a ground lease to facilitate the ground-up development of 80 Saratoga, a 200-unit Low Income Tax Credit ("LIHTC") community in Santa Clara, California. The project will be developed by The Pacific Companies, an Idaho-based firm and prolific developer of affordable housing throughout the Western United States. |
Star Holdings Reports Third Quarter 2023 ResultsStar Holdings (NASDAQ: STHO) announced today that it has filed its Quarterly Report on Form 10-Q for the quarter ended September 30, 2023 with the Securities and Exchange Commission. |
Safehold Reports Third Quarter 2023 ResultsSafehold Inc. (NYSE: SAFE) reported results for the third quarter 2023. |
SAFE Price Returns
| 1-mo | 22.63% |
| 3-mo | 26.26% |
| 6-mo | 13.06% |
| 1-year | -4.58% |
| 3-year | -6.13% |
| 5-year | 150.28% |
| YTD | -0.86% |
| 2023 | 179.57% |
| 2022 | -63.41% |
| 2021 | 11.15% |
| 2020 | 82.45% |
| 2019 | 118.06% |
SAFE Dividends
| Ex-Dividend Date | Type | Payout Amount | Change | ||||||
|---|---|---|---|---|---|---|---|---|---|
| Loading, please wait... | |||||||||
Continue Researching SAFE
Here are a few links from around the web to help you further your research on Safehold Inc's stock as an investment opportunity:Safehold Inc (SAFE) Stock Price | Nasdaq
Safehold Inc (SAFE) Stock Quote, History and News - Yahoo Finance
Safehold Inc (SAFE) Stock Price and Basic Information | MarketWatch
Loading social stream, please wait...