Safety Insurance Group, Inc. (SAFT): Price and Financial Metrics
SAFT Stock Summary
- SAFT's current price/earnings ratio is 8.86, which is higher than just 9.36% of US stocks with positive earnings.
- Of note is the ratio of Safety Insurance Group Inc's sales and general administrative expense to its total operating expenses; 87.77% of US stocks have a lower such ratio.
- The volatility of Safety Insurance Group Inc's share price is greater than that of merely 4.02% US stocks with at least 200 days of trading history.
- If you're looking for stocks that are quantitatively similar to Safety Insurance Group Inc, a group of peers worth examining would be CVCO, CRWS, DORM, UVE, and JCS.
- SAFT's SEC filings can be seen here. And to visit Safety Insurance Group Inc's official web site, go to www.safetyinsurance.com.
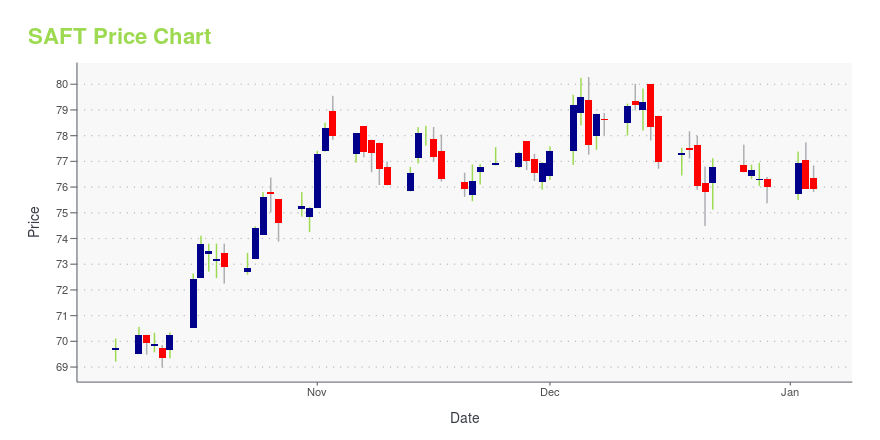
SAFT Stock Price Chart Interactive Chart >
SAFT Price/Volume Stats
Current price | $81.74 | 52-week high | $91.03 |
Prev. close | $82.26 | 52-week low | $65.45 |
Day low | $81.16 | Volume | 98,300 |
Day high | $83.58 | Avg. volume | 73,531 |
50-day MA | $78.39 | Dividend yield | 4.38% |
200-day MA | $75.19 | Market Cap | 1.22B |
Safety Insurance Group, Inc. (SAFT) Company Bio
Safety Insurance Group provides private passenger automobile insurance in Massachusetts and New Hampshire. The company was founded in 1979 and is based in Boston, Massachusetts.
SAFT Price Forecast Based on DCF Valuation
Current Price | DCF Fair Value Target: | Forecasted Gain: |
$81.74 | $47.64 | -42% |
Below please find a table outlining a discounted cash flow forecast for SAFT, in which we model out valuation assuming a variety of terminal growth rates. To summarize, we found that Safety Insurance Group Inc ranked in the 40th percentile in terms of potential gain offered. We should note, though, that all scenearios modelled for this stock suggest it is overvalued. As for the metrics that stood out in our discounted cash flow analysis of Safety Insurance Group Inc, consider:
- The company's compound free cash flow growth rate over the past 5.81 years comes in at 0.01%; that's greater than only 24.99% of US stocks we're applying DCF forecasting to.
- The business' balance sheet suggests that 5% of the company's capital is sourced from debt; this is greater than only 17.23% of the free cash flow producing stocks we're observing.
- The company's cost of debt, derived from its interest coverage, tax rate, and market capitalization, is greater than just 0% of stocks in its sector (Financial Services).
Terminal Growth Rate in Free Cash Flow | Return Relative to Current Share Price |
0% | -43% |
1% | -42% |
2% | -42% |
3% | -41% |
4% | -41% |
5% | -40% |
Want more companies with a valuation profile/forecast similar to that of Safety Insurance Group Inc? See NDAQ, AON, ICCH, ICE, and RLI.
Latest SAFT News From Around the Web
Below are the latest news stories about Safety Insurance Group Inc that investors may wish to consider to help them evaluate SAFT as an investment opportunity.
Safety Announces Fourth Quarter and Year End 2020 ResultsBOSTON--(BUSINESS WIRE)--Safety Insurance Group, Inc. (NASDAQ:SAFT) (“the Company”) today reported fourth quarter 2020 results. Net income for the quarter ended December 31, 2020 was $53.0 million, or $3.55 per diluted share, compared to net income of $28.1 million, or $1.82 per diluted share, for the comparable 2019 period. Net income for the year ended December 31, 2020 was $138.2 million, or $9.18 per diluted share, compared to net income of $99.6 million, or $6.46 per diluted share, for the |
Safety Insurance Group Earnings and Growth Analysis : Stock market Insights & financial analysisSafety Insurance Group announce their quarterly, annual earnings. See the latest EPS estimates. Listen to the conference call and remind yourself by… |
Safety Insurance declares $0.90 dividendSafety Insurance (SAFT) declares $0.90/share quarterly dividend, in line with previous.Forward yield 4.64%Payable March 15; for shareholders of record March 5; ex-div March 4.See SAFT Dividend Scorecard, Yield Chart, & Dividend Growth.... |
Safety Declares First Quarter 2021 Dividend and Schedules Year-End 2020 EventsThe Board of Directors of Safety Insurance Group, Inc. (NASDAQ:SAFT) today approved a $0.90 per share quarterly cash dividend on its issued and outstanding common stock payable on March 15, 2021 to shareholders of record at the close of business on March 5, 2021. |
Does Safety Insurance Group (NASDAQ:SAFT) Deserve A Spot On Your Watchlist?Some have more dollars than sense, they say, so even companies that have no revenue, no profit, and a record of falling... |
SAFT Price Returns
1-mo | 11.85% |
3-mo | 9.43% |
6-mo | 15.84% |
1-year | 6.78% |
3-year | 24.78% |
5-year | 80.67% |
YTD | 6.09% |
2020 | -11.81% |
2019 | 17.22% |
2018 | 5.67% |
2017 | 13.66% |
2016 | 36.69% |
SAFT Dividends
Ex-Dividend Date | Type | Payout Amount | Change | ||||||
---|---|---|---|---|---|---|---|---|---|
Loading, please wait... |
Continue Researching SAFT
Want to see what other sources are saying about Safety Insurance Group Inc's financials and stock price? Try the links below:Safety Insurance Group Inc (SAFT) Stock Price | Nasdaq
Safety Insurance Group Inc (SAFT) Stock Quote, History and News - Yahoo Finance
Safety Insurance Group Inc (SAFT) Stock Price and Basic Information | MarketWatch
Get Free Updates
Join thousands of investors who get the latest news, insights and top rated picks from StockNews.com!
Loading social stream, please wait...