Science Applications International Corp. (SAIC): Price and Financial Metrics
GET POWR RATINGS... FREE!
SAIC POWR Grades
- SAIC scores best on the Value dimension, with a Value rank ahead of 87.39% of US stocks.
- The strongest trend for SAIC is in Growth, which has been heading up over the past 177 days.
- SAIC's current lowest rank is in the Momentum metric (where it is better than 53.81% of US stocks).
SAIC Stock Summary
- The capital turnover (annual revenue relative to shareholder's equity) for SAIC is 4.46 -- better than 89.55% of US stocks.
- For SAIC, its debt to operating expenses ratio is greater than that reported by 85.93% of US equities we're observing.
- In terms of volatility of its share price, SAIC is more volatile than just 17.75% of stocks we're observing.
- Stocks with similar financial metrics, market capitalization, and price volatility to SCIENCE APPLICATIONS INTERNATIONAL CORP are LDOS, LEA, USPH, HLX, and LAUR.
- Visit SAIC's SEC page to see the company's official filings. To visit the company's web site, go to www.saic.com.
SAIC Valuation Summary
- SAIC's EV/EBIT ratio is 17.9; this is 6.28% lower than that of the median Technology stock.
- Over the past 116 months, SAIC's EV/EBIT ratio has gone up 12.4.
Below are key valuation metrics over time for SAIC.
Stock | Date | P/S | P/B | P/E | EV/EBIT |
---|---|---|---|---|---|
SAIC | 2023-03-21 | 0.8 | 3.4 | 21.3 | 17.9 |
SAIC | 2023-03-20 | 0.8 | 3.4 | 21.0 | 17.8 |
SAIC | 2023-03-17 | 0.7 | 3.3 | 20.8 | 17.6 |
SAIC | 2023-03-16 | 0.8 | 3.4 | 21.1 | 17.9 |
SAIC | 2023-03-15 | 0.8 | 3.4 | 21.1 | 17.8 |
SAIC | 2023-03-14 | 0.8 | 3.4 | 21.3 | 17.9 |
SAIC Growth Metrics
- The 4 year cash and equivalents growth rate now stands at -10.48%.
- Its 2 year cash and equivalents growth rate is now at -43.62%.
- The 3 year net income to common stockholders growth rate now stands at 102.19%.

The table below shows SAIC's growth in key financial areas (numbers in millions of US dollars).
Date | Revenue | Operating Cash Flow | Net Income to Common Stock |
---|---|---|---|
2022-12-31 | 7,518 | 490 | 269 |
2022-09-30 | 7,507 | 496 | 260 |
2022-06-30 | 7,512 | 447 | 269 |
2022-03-31 | 7,394 | 518 | 277 |
2021-12-31 | 7,329 | 468 | 296 |
2021-09-30 | 7,249 | 565 | 285 |
SAIC's Quality Factors
The “Quality” component of the POWR Ratings focuses on 31 different factors of a companies fundamentals and operational strength. Here are some key insights as we drill into the specifics of these quality attributes.- SAIC has a Quality Grade of C, ranking ahead of 36.86% of graded US stocks.
- SAIC's asset turnover comes in at 1.244 -- ranking 12th of 83 Computers stocks.
- CACI, LTRX, and CSCO are the stocks whose asset turnover ratios are most correlated with SAIC.
The table below shows SAIC's key quality metrics over time.
Period | Asset Turnover | Gross Margin | ROIC |
---|---|---|---|
2021-07-30 | 1.244 | 0.118 | 0.159 |
2021-04-30 | 1.229 | 0.115 | 0.144 |
2021-01-29 | 1.198 | 0.112 | 0.122 |
2020-10-30 | 1.220 | 0.110 | 0.120 |
2020-07-31 | 1.252 | 0.108 | 0.121 |
2020-05-01 | 1.301 | 0.109 | 0.130 |
SAIC Stock Price Chart Interactive Chart >
SAIC Price/Volume Stats
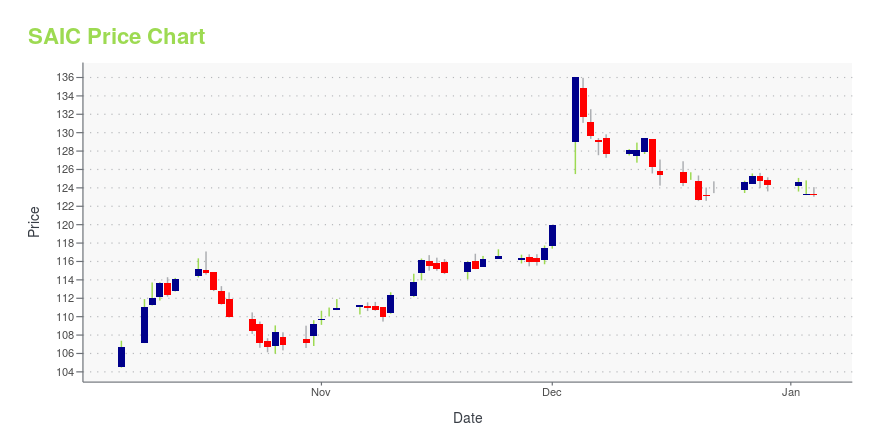
Current price | $106.60 | 52-week high | $117.94 |
Prev. close | $106.65 | 52-week low | $79.33 |
Day low | $106.41 | Volume | 109,458 |
Day high | $107.49 | Avg. volume | 275,866 |
50-day MA | $105.17 | Dividend yield | 1.4% |
200-day MA | $100.55 | Market Cap | 5.82B |
Science Applications International Corp. (SAIC) Company Bio
SAIC provides technical, engineering, and enterprise information technology (IT) services in the United States. The companys offerings include engineering and maintenance of ground and maritime systems, logistics, training, and simulation, as well as operation and program support services; and end-to-end services spanning the design, development, integration, deployment, management and operations, sustainment, and security of customers entire IT infrastructure. The company was founded in 1969 and is based in McLean, Virginia.
Latest SAIC News From Around the Web
Below are the latest news stories about SCIENCE APPLICATIONS INTERNATIONAL CORP that investors may wish to consider to help them evaluate SAIC as an investment opportunity.
SAIC Board of Directors Declares Cash DividendRESTON, Va., March 29, 2023--Science Applications International Corp. (NYSE: SAIC) announced today that the company’s board of directors declared a cash dividend of $0.37 per share of the company’s common stock payable on April 28, 2023 to stockholders of record on April 14, 2023. |
SAIC Appoints Barbara Graham to Lead Navy Business UnitRESTON, Va., March 29, 2023--Science Applications International Corp. (NYSE: SAIC) has appointed Barbara Graham as senior vice president of the company’s Navy Business Unit. |
Science Applications (SAIC) to Sell Logistics & Supply Chain UnitScience Applications (SAIC) signs an agreement to sell its logistics and supply chain management business to ASRC Federal. |
SAIC Signs Definitive Agreement to Sell Its Logistics and Supply Chain Management Business to ASRC Federal for $350 MillionRESTON, Va., March 23, 2023--Science Applications International Corp. (NYSE: SAIC) announced today that it has signed a definitive agreement to sell its logistics and supply chain management business to ASRC Federal Holding Company, LLC ("ASRC Federal"), a subsidiary of Arctic Slope Regional Corporation, for $350 million in cash. The transaction is expected to close in the first half of SAIC’s fiscal year 2024, subject to the satisfaction of customary closing conditions, including the receipt of |
ASRC Federal to Acquire Logistics and Supply Chain Management Arm of SAICToday, ASRC Federal announced it has entered into a definitive agreement to acquire the logistics and supply chain management business of Science Applications International Corporation (NYSE: SAIC). With this acquisition, ASRC Federal will become a leading provider of secure, technology-enabled supply chain management and logistics solutions for the Defense Logistics Agency (DLA) which provides services to Department of Defense (DoD) agencies, including the U.S. Army, U.S. Air Force and U.S. Nav |
SAIC Price Returns
1-mo | -0.04% |
3-mo | -3.57% |
6-mo | 21.47% |
1-year | 15.67% |
3-year | 52.69% |
5-year | 47.39% |
YTD | -3.57% |
2022 | 34.95% |
2021 | -10.20% |
2020 | 10.81% |
2019 | 39.15% |
2018 | -15.48% |
SAIC Dividends
Ex-Dividend Date | Type | Payout Amount | Change | ||||||
---|---|---|---|---|---|---|---|---|---|
Loading, please wait... |
Continue Researching SAIC
Want to see what other sources are saying about Science Applications International Corp's financials and stock price? Try the links below:Science Applications International Corp (SAIC) Stock Price | Nasdaq
Science Applications International Corp (SAIC) Stock Quote, History and News - Yahoo Finance
Science Applications International Corp (SAIC) Stock Price and Basic Information | MarketWatch
Loading social stream, please wait...