Boston Beer Co. Cl A (SAM): Price and Financial Metrics
GET POWR RATINGS... FREE!
SAM POWR Grades
- SAM scores best on the Growth dimension, with a Growth rank ahead of 96.33% of US stocks.
- SAM's strongest trending metric is Quality; it's been moving up over the last 177 days.
- SAM ranks lowest in Sentiment; there it ranks in the 1st percentile.
SAM Stock Summary
- With a price/earnings ratio of 178.25, BOSTON BEER CO INC P/E ratio is greater than that of about 97.44% of stocks in our set with positive earnings.
- For SAM, its debt to operating expenses ratio is greater than that reported by only 13.2% of US equities we're observing.
- The volatility of BOSTON BEER CO INC's share price is greater than that of just 17.69% US stocks with at least 200 days of trading history.
- Stocks that are quantitatively similar to SAM, based on their financial statements, market capitalization, and price volatility, are NHTC, SGMA, LFVN, WING, and SEAT.
- Visit SAM's SEC page to see the company's official filings. To visit the company's web site, go to www.bostonbeer.com.
SAM Valuation Summary
- SAM's EV/EBIT ratio is 125.6; this is 559.32% higher than that of the median Consumer Defensive stock.
- Over the past 243 months, SAM's price/earnings ratio has gone up 91.8.
Below are key valuation metrics over time for SAM.
Stock | Date | P/S | P/B | P/E | EV/EBIT |
---|---|---|---|---|---|
SAM | 2023-01-18 | 1.7 | 4.0 | 159.2 | 125.6 |
SAM | 2023-01-17 | 1.8 | 4.1 | 164.3 | 129.8 |
SAM | 2023-01-13 | 1.8 | 4.1 | 163.5 | 129.2 |
SAM | 2023-01-12 | 1.8 | 4.0 | 160.0 | 126.3 |
SAM | 2023-01-11 | 1.7 | 3.9 | 157.5 | 124.3 |
SAM | 2023-01-10 | 1.7 | 3.8 | 151.9 | 119.6 |
SAM Growth Metrics
- Its 3 year cash and equivalents growth rate is now at -84.67%.
- The year over year cash and equivalents growth rate now stands at -89.1%.
- Its 2 year revenue growth rate is now at 80.62%.

The table below shows SAM's growth in key financial areas (numbers in millions of US dollars).
Date | Revenue | Operating Cash Flow | Net Income to Common Stock |
---|---|---|---|
2022-09-30 | 2,448.191 | 230.285 | 26.895 |
2022-06-30 | 2,413.381 | 146.816 | -58.812 |
2022-03-31 | 2,399.943 | -4.516 | -52.966 |
2021-12-31 | 2,057.622 | 56.297 | 14.553 |
2021-09-30 | 2,170.465 | 95.452 | 99.156 |
2021-06-30 | 2,101.614 | 180.383 | 238.345 |
SAM's Quality Factors
The “Quality” component of the POWR Ratings focuses on 31 different factors of a companies fundamentals and operational strength. Here are some key insights as we drill into the specifics of these quality attributes.- SAM has a Quality Grade of C, ranking ahead of 70.45% of graded US stocks.
- SAM's asset turnover comes in at 1.48 -- ranking 2nd of 16 Beer & Liquor stocks.
- JSDA, BTTR, and NBEV are the stocks whose asset turnover ratios are most correlated with SAM.
The table below shows SAM's key quality metrics over time.
Period | Asset Turnover | Gross Margin | ROIC |
---|---|---|---|
2021-09-25 | 1.480 | 0.421 | 0.135 |
2021-06-26 | 1.471 | 0.467 | 0.347 |
2021-03-27 | 1.455 | 0.470 | 0.371 |
2020-12-26 | 1.364 | 0.469 | 0.309 |
2020-09-26 | 1.323 | 0.470 | 0.289 |
2020-06-27 | 1.308 | 0.471 | 0.243 |
SAM Price Target
For more insight on analysts targets of SAM, see our SAM price target page. And for a list of of all stocks sorted by upside potential based on analyst target price, see our Top Price Target page.
Average Price Target | $665.60 | Average Broker Recommendation | 1.8 (Moderate Buy) |
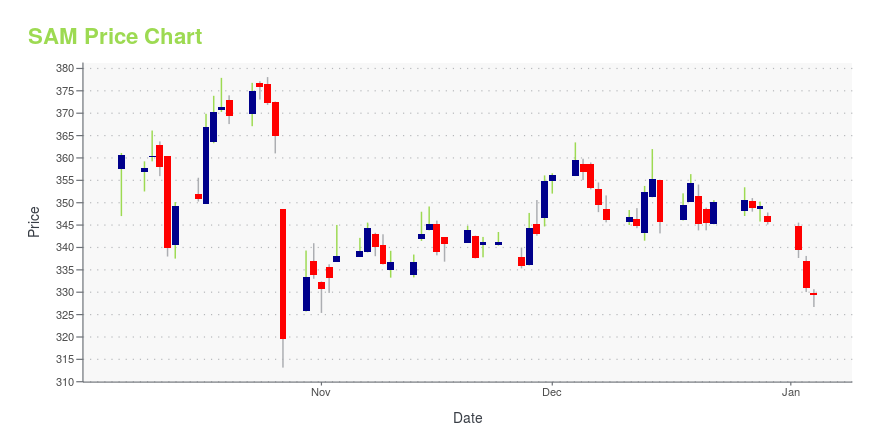
SAM Stock Price Chart Interactive Chart >
SAM Price/Volume Stats
Current price | $377.47 | 52-week high | $454.11 |
Prev. close | $392.29 | 52-week low | $287.00 |
Day low | $377.02 | Volume | 121,200 |
Day high | $394.09 | Avg. volume | 127,242 |
50-day MA | $356.71 | Dividend yield | N/A |
200-day MA | $350.94 | Market Cap | 4.64B |
Boston Beer Co. Cl A (SAM) Company Bio
The Boston Beer Company is an American brewery founded in 1984. Boston Beer Company's first brand of beer was named Samuel Adams after Founding Father Samuel Adams, an American revolutionary patriot. Since its founding, Boston Beer has started several other brands, and in 2019 completed a merger with Dogfish Head Brewery. (Source:Wikipedia)
Latest SAM News From Around the Web
Below are the latest news stories about BOSTON BEER CO INC that investors may wish to consider to help them evaluate SAM as an investment opportunity.
Boston Beer Makes Morningstar Undervalued Stock List"Consumer-defensive stocks thrived (relatively speaking) in 2022," according to a Morningstar commentary. Further stock market gains could leave defensive stocks behind, but the bear market may not be over. Here are Morningstar's top picks among undervalued consumer defensive stocks, in alphabetical order. |
Factors Likely to Influence Archer Daniels' (ADM) Q4 EarningsArcher Daniels (ADM) Q4 results are likely to reflect gains from solid demand, a strong Nutrition unit and efforts to expand its solutions portfolio. High costs and inflation are likely to have ailed. |
15 Best Sin Stocks To Buy in 2023In this article, we will take a look at the 15 best sin stocks to buy in 2023. If you want to skip our introduction about the industry, then go directly to 5 Best Sin Stocks To Buy in 2023. Stocks of companies that are involved in businesses like gambling, tobacco production, adult entertainment, alcoholic […] |
Beverage double shot: Boston Beer, National Beverage are cut to Underperform at JefferiesJefferies weighed in on the beverage sector in a new note published on Wednesday. Read more on FIZZ and SAM stocks. |
Jefferies Downgrades Boston Beer As Muted Trends In Key Categories Threaten GrowthJefferies analyst Kevin Grundy downgraded Boston Beer Company Inc (NYSE: SAM) from Hold to Underperform and lowered the price target from $331 to $275. The analyst said SAM's top-line recovery remains largely tethered to stabilization in malt-based seltzers (< 45% of mix), where the blistering '19-20 growth rates are long gone given difficult Y/Y comps, RTD competition, on-premise recovery, consumer fatigue, and higher consumer trial some five years into category's development. The analyst forec |
SAM Price Returns
1-mo | 14.55% |
3-mo | 2.33% |
6-mo | -0.43% |
1-year | -10.30% |
3-year | 5.92% |
5-year | 97.73% |
YTD | 14.55% |
2022 | -34.76% |
2021 | -49.20% |
2020 | 163.14% |
2019 | 56.89% |
2018 | 26.03% |
Continue Researching SAM
Want to do more research on Boston Beer Co Inc's stock and its price? Try the links below:Boston Beer Co Inc (SAM) Stock Price | Nasdaq
Boston Beer Co Inc (SAM) Stock Quote, History and News - Yahoo Finance
Boston Beer Co Inc (SAM) Stock Price and Basic Information | MarketWatch
Loading social stream, please wait...