
Seaboard Corporation (SEB): Price and Financial Metrics
SEB Price/Volume Stats
| Current price | $3,161.86 | 52-week high | $3,862.00 |
| Prev. close | $3,143.85 | 52-week low | $2,955.33 |
| Day low | $3,120.30 | Volume | 1,100 |
| Day high | $3,209.69 | Avg. volume | 3,120 |
| 50-day MA | $3,176.71 | Dividend yield | 0.29% |
| 200-day MA | $3,369.04 | Market Cap | 3.07B |
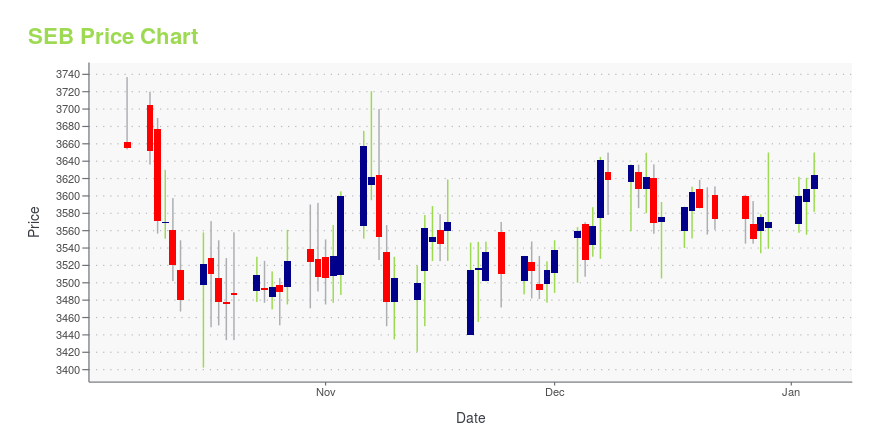
SEB Stock Price Chart Interactive Chart >
Seaboard Corporation (SEB) Company Bio
Seaboard Corporation operates as a diverse agribusiness and transportation company worldwide. Its Pork division is involved in hog production and pork processing; and the production and sale of fresh and frozen pork products to further processors, foodservice operators, grocery stores, distributors, and retail outlets. The company was founded in 1918 and is based in Shawnee Mission, Kansas.
Latest SEB News From Around the Web
Below are the latest news stories about SEABOARD CORP that investors may wish to consider to help them evaluate SEB as an investment opportunity.
SEABOARD CORPORATION REPORT OF EARNINGS AND DIVIDEND DECLARATIONThe following is a report of earnings for Seaboard Corporation (NYSE American symbol: SEB), with offices at 9000 West 67th Street, Merriam, Kansas, for the three- and nine-months ended September 30, 2023 and October 1, 2022, in millions of dollars except share and per share amounts. |
Seaboard Corporation Announces Share RepurchaseSeaboard Corporation (NYSE AMERICAN: SEB) ("Seaboard") today announced that it has agreed to repurchase 189,724 shares of its common stock, $1.00 par value per share ("Common Stock"), at a purchase price of $3,162.50 per share. This represents a 15.7% discount to the 180-day volume weighted average trading price of the Common Stock as of October 6, 2023, a 14.9% discount to the 30-day volume weighted average trading price of the Common Stock as of October 6, 2023 and a 13.5% discount to closing |
15 Biggest Agricultural Companies in the USIn this article, we shall cover the 15 biggest agricultural companies in the US. To skip our detailed analysis of some of the risks and potentials affecting the American agricultural industry in 2023, go directly and see 5 Biggest Agricultural Companies in the US. According to an outlook presented by the US Department of Agriculture […] |
Seaboard (SEB): An Underappreciated Gem in the Stock MarketA Comprehensive Analysis of Seaboard's Market Value |
7 Bargain Stocks to Snatch Up Before They Bounce Back in the Second HalfWhile the best discounts may have faded in the spring of 2020, there are still bargain stocks to buy for adventurous investors. |
SEB Price Returns
| 1-mo | 0.59% |
| 3-mo | -1.35% |
| 6-mo | -12.30% |
| 1-year | -11.15% |
| 3-year | -19.90% |
| 5-year | -21.57% |
| YTD | -11.32% |
| 2023 | -5.21% |
| 2022 | -3.78% |
| 2021 | 30.14% |
| 2020 | -28.49% |
| 2019 | 20.41% |
SEB Dividends
| Ex-Dividend Date | Type | Payout Amount | Change | ||||||
|---|---|---|---|---|---|---|---|---|---|
| Loading, please wait... | |||||||||
Continue Researching SEB
Here are a few links from around the web to help you further your research on Seaboard Corp's stock as an investment opportunity:Seaboard Corp (SEB) Stock Price | Nasdaq
Seaboard Corp (SEB) Stock Quote, History and News - Yahoo Finance
Seaboard Corp (SEB) Stock Price and Basic Information | MarketWatch
Loading social stream, please wait...