Sealed Air Corporation (SEE): Price and Financial Metrics
GET POWR RATINGS... FREE!
SEE POWR Grades
- Quality is the dimension where SEE ranks best; there it ranks ahead of 96.76% of US stocks.
- SEE's strongest trending metric is Momentum; it's been moving up over the last 179 days.
- SEE ranks lowest in Value; there it ranks in the 28th percentile.
SEE Stock Summary
- Sealed Air Corp's capital turnover -- a measure of revenue relative to shareholder's equity -- is better than 98.8% of US listed stocks.
- SEE's went public 34.27 years ago, making it older than 89.7% of listed US stocks we're tracking.
- Equity multiplier, or assets relative to shareholders' equity, comes in at 42.54 for Sealed Air Corp; that's greater than it is for 99.22% of US stocks.
- Stocks with similar financial metrics, market capitalization, and price volatility to Sealed Air Corp are GSKY, CVGI, LEA, LDOS, and BR.
- Visit SEE's SEC page to see the company's official filings. To visit the company's web site, go to www.sealedair.com.
SEE Valuation Summary
- In comparison to the median Consumer Cyclical stock, SEE's price/sales ratio is 28.57% higher, now standing at 1.8.
- Over the past 243 months, SEE's price/sales ratio has gone up 0.7.
- Over the past 243 months, SEE's EV/EBIT ratio has gone up 5.
Below are key valuation metrics over time for SEE.
Stock | Date | P/S | P/B | P/E | EV/EBIT |
---|---|---|---|---|---|
SEE | 2021-08-27 | 1.8 | 97.6 | 18.5 | 15.3 |
SEE | 2021-08-26 | 1.8 | 97.0 | 18.4 | 15.2 |
SEE | 2021-08-25 | 1.8 | 97.7 | 18.5 | 15.3 |
SEE | 2021-08-24 | 1.7 | 95.9 | 18.2 | 15.1 |
SEE | 2021-08-23 | 1.7 | 95.3 | 18.1 | 15.0 |
SEE | 2021-08-20 | 1.7 | 94.9 | 18.0 | 15.0 |
SEE Growth Metrics
- The 4 year net income to common stockholders growth rate now stands at 0.61%.
- The year over year net cashflow from operations growth rate now stands at 59.32%.
- The 5 year price growth rate now stands at -39.94%.

The table below shows SEE's growth in key financial areas (numbers in millions of US dollars).
Date | Revenue | Operating Cash Flow | Net Income to Common Stock |
---|---|---|---|
2021-12-31 | 5,533.8 | 709.7 | 506.8 |
2021-09-30 | 5,343.2 | 704.3 | 468.1 |
2021-06-30 | 5,173.7 | 723.5 | 494.4 |
2021-03-31 | 4,996.4 | 775.9 | 486.4 |
2020-12-31 | 4,903.2 | 737 | 502.9 |
2020-09-30 | 4,861.2 | 670.1 | 465 |
SEE's Quality Factors
The “Quality” component of the POWR Ratings focuses on 31 different factors of a companies fundamentals and operational strength. Here are some key insights as we drill into the specifics of these quality attributes.- SEE has a Quality Grade of B, ranking ahead of 93.69% of graded US stocks.
- SEE's asset turnover comes in at 0.884 -- ranking 21st of 89 Chemicals stocks.
- ICL, AVNT, and WLK are the stocks whose asset turnover ratios are most correlated with SEE.
The table below shows SEE's key quality metrics over time.
Period | Asset Turnover | Gross Margin | ROIC |
---|---|---|---|
2021-09-30 | 0.884 | 0.305 | 0.149 |
2021-06-30 | 0.868 | 0.315 | 0.147 |
2021-03-31 | 0.847 | 0.324 | 0.146 |
2020-12-31 | 0.840 | 0.328 | 0.146 |
2020-09-30 | 0.845 | 0.332 | 0.133 |
2020-06-30 | 0.847 | 0.331 | 0.124 |
SEE Price Target
For more insight on analysts targets of SEE, see our SEE price target page. And for a list of of all stocks sorted by upside potential based on analyst target price, see our Top Price Target page.
Average Price Target | $65.86 | Average Broker Recommendation | 1.53 (Moderate Buy) |
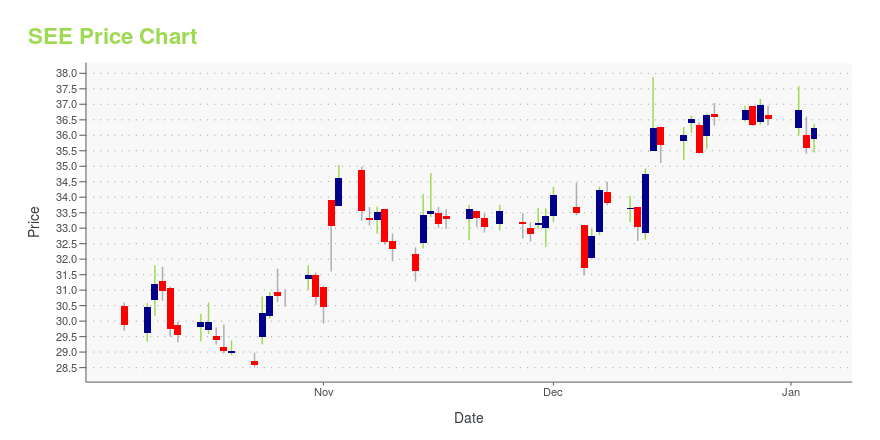
SEE Stock Price Chart Interactive Chart >
SEE Price/Volume Stats
Current price | $58.31 | 52-week high | $70.72 |
Prev. close | $59.47 | 52-week low | $53.87 |
Day low | $58.22 | Volume | 809,900 |
Day high | $60.10 | Avg. volume | 926,539 |
50-day MA | $62.47 | Dividend yield | 1.37% |
200-day MA | $63.50 | Market Cap | 8.52B |
Sealed Air Corporation (SEE) Company Bio
Sealed Air Corporation provides food safety and security, facility hygiene, and product protection solutions worldwide. The Company's segments include Food Care, which provides integrated system solutions for retailers and food-service operators; Diversey Care, which provides integrated system solutions for food safety and security under Diversey brand; Product Care, which provides product care solutions to meet cushioning, void fill, positioning or block-and-bracing and surface protection, among others, and Other, which includes corporate, medical applications and new ventures businesses. The company was founded in 1960 and is based in Charlotte, North Carolina.
Latest SEE News From Around the Web
Below are the latest news stories about Sealed Air Corp that investors may wish to consider to help them evaluate SEE as an investment opportunity.
Sealed Air cut to Neutral at JPM but shares near all-time highSealed Air (SEE +2.7%) is on the rise even after J.P. Morgan downgraded shares to Neutral from Overweight with a $71 price target, saying the company likely will continue to sustain inflationary headwinds in raw materials and its operating expenses amid higher labor and supply chain costs. JPM's Jeffrey Zekauskas... |
Sealed Air declares $0.20 dividend (NYSE:SEE)Sealed Air (NYSE:SEE) declares $0.20/share quarterly dividend, in line with previous.Forward yield 1.17%Payable March 25; for shareholders of record March 11; ex-div March 10.See SEE… |
Sealed Air cut to Neutral at JPM but shares near all-time high (NYSE:SEE)Sealed Air < |
SEE Declares Quarterly Cash DividendCHARLOTTE, N.C., February 25, 2022--SEE (NYSE: SEE) announced today that its Board of Directors has declared a quarterly cash dividend of $0.20 per common share. The dividend is payable on March 25, 2022 to stockholders of record at the close of business on March 11, 2022. |
Where Sealed Air Stands With AnalystsAnalysts have provided the following ratings for Sealed Air (NYSE: SEE ) within the last quarter: Bullish Somewhat Bullish Indifferent Somewhat Bearish Bearish Total Ratings 1 1 2 0 0 Last 30D 0 0 1 0 0 1M Ago 0 0 0 0 0 2M Ago 1 1 1 0 0 3M Ago 0 0 0 0 0 In the last 3 months, 4 analysts have offered 12-month price targets for Sealed Air. The company has an average price target of $74.0 with a high of $79.00 and a low of $70.00. Below is a summary of how these 4 analysts rated Sealed Air over the past 3 months. The Full story available on Benzinga.com |
SEE Price Returns
1-mo | N/A |
3-mo | -12.64% |
6-mo | -13.03% |
1-year | 1.14% |
3-year | 42.67% |
5-year | 40.54% |
YTD | -13.03% |
2021 | 49.38% |
2020 | 16.97% |
2019 | 16.11% |
2018 | -28.20% |
2017 | 10.27% |
SEE Dividends
Ex-Dividend Date | Type | Payout Amount | Change | ||||||
---|---|---|---|---|---|---|---|---|---|
Loading, please wait... |
Continue Researching SEE
Want to do more research on Sealed Air Corp's stock and its price? Try the links below:Sealed Air Corp (SEE) Stock Price | Nasdaq
Sealed Air Corp (SEE) Stock Quote, History and News - Yahoo Finance
Sealed Air Corp (SEE) Stock Price and Basic Information | MarketWatch
Loading social stream, please wait...