
SEI Investments Company (SEIC): Price and Financial Metrics
SEIC Price/Volume Stats
| Current price | $66.88 | 52-week high | $72.54 |
| Prev. close | $66.07 | 52-week low | $52.19 |
| Day low | $65.79 | Volume | 743,866 |
| Day high | $67.23 | Avg. volume | 594,602 |
| 50-day MA | $66.43 | Dividend yield | 1.36% |
| 200-day MA | $64.38 | Market Cap | 8.79B |
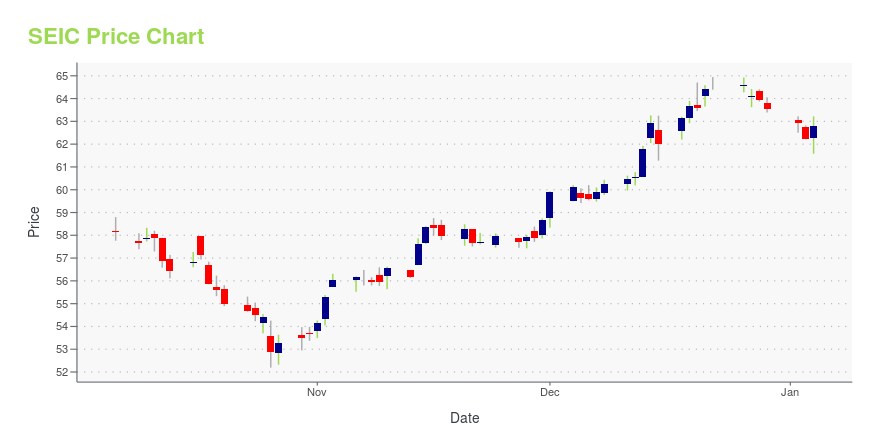
SEIC Stock Price Chart Interactive Chart >
SEI Investments Company (SEIC) Company Bio
SEI Investments provides wealth management and investment advisory services to its clients through its subsidiaries. The company was founded in 1968 and is based in Oaks, Pennsylvania.
Latest SEIC News From Around the Web
Below are the latest news stories about SEI INVESTMENTS CO that investors may wish to consider to help them evaluate SEIC as an investment opportunity.
SEI Investments (SEIC) Buys Altigo, Seeks Growth in AlternativesSEI Investments (SEIC) acquires cloud-based technology platform Altigo in an effort to expand its opportunity in the alternative investments space. |
SEI Investments Co's Dividend AnalysisSEI Investments Co (NASDAQ:SEIC) recently announced a dividend of $0.46 per share, payable on 2024-01-09, with the ex-dividend date set for 2023-12-27. As investors look forward to this upcoming payment, the spotlight also shines on the company's dividend history, yield, and growth rates. Using the data from GuruFocus, let's look into SEI Investments Co's dividend performance and assess its sustainability. |
SEI Announces Wayne Withrow to Step AwaySEI® (NASDAQ: SEIC) today announced Wayne Withrow, Executive Vice President and Head of Global Asset Management, will step away effective Feb. 28, 2024 to focus his time on other parts of his life. For more than 30 years, Withrow contributed to the company's evolution and growth, leading in various roles across technology, operations, and asset management. SEI will conduct a search internally and externally for Withrow's replacement. |
Why You Might Be Interested In SEI Investments Company (NASDAQ:SEIC) For Its Upcoming DividendSEI Investments Company ( NASDAQ:SEIC ) is about to trade ex-dividend in the next 4 days. Typically, the ex-dividend... |
SEI Acquires AltigoSEI® (NASDAQ:SEIC) today announced the acquisition of Altigo, a cloud-based technology platform that provides inventory, e-subscription, and reporting capabilities for alternative investments. With 35% of investors aged 25 to 44 years indicating an increased demand for alts1 and global alternative assets expected to hit $23 trillion by 20272, fund sponsors are seeking efficient access to private clients, and SEI believes those investors want access to a variety of high-quality alternative invest |
SEIC Price Returns
| 1-mo | 3.31% |
| 3-mo | 1.18% |
| 6-mo | 5.41% |
| 1-year | 8.52% |
| 3-year | 14.69% |
| 5-year | 17.39% |
| YTD | 5.99% |
| 2023 | 10.59% |
| 2022 | -2.94% |
| 2021 | 7.38% |
| 2020 | -11.10% |
| 2019 | 43.35% |
SEIC Dividends
| Ex-Dividend Date | Type | Payout Amount | Change | ||||||
|---|---|---|---|---|---|---|---|---|---|
| Loading, please wait... | |||||||||
Continue Researching SEIC
Here are a few links from around the web to help you further your research on Sei Investments Co's stock as an investment opportunity:Sei Investments Co (SEIC) Stock Price | Nasdaq
Sei Investments Co (SEIC) Stock Quote, History and News - Yahoo Finance
Sei Investments Co (SEIC) Stock Price and Basic Information | MarketWatch
Loading social stream, please wait...