
Sound Financial Bancorp, Inc. (SFBC): Price and Financial Metrics
SFBC Price/Volume Stats
| Current price | $42.80 | 52-week high | $44.95 |
| Prev. close | $42.99 | 52-week low | $33.72 |
| Day low | $42.31 | Volume | 900 |
| Day high | $42.80 | Avg. volume | 793 |
| 50-day MA | $40.78 | Dividend yield | 1.78% |
| 200-day MA | $38.24 | Market Cap | 109.44M |
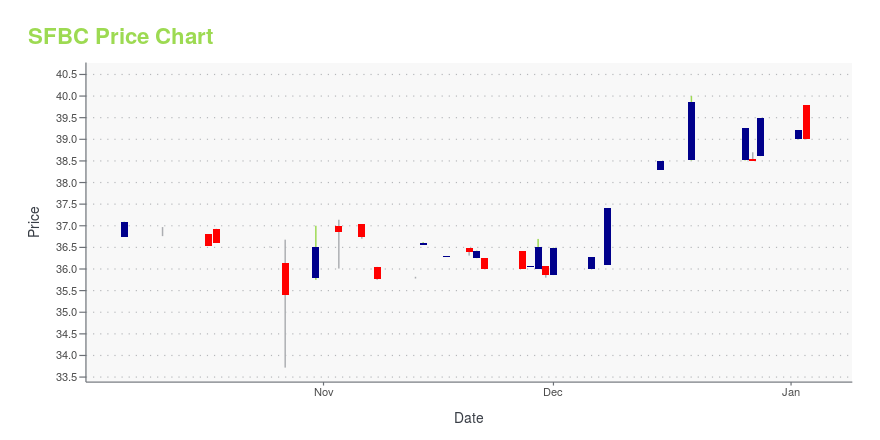
SFBC Stock Price Chart Interactive Chart >
Sound Financial Bancorp, Inc. (SFBC) Company Bio
Sound Financial Bancorp, Inc. operates as the bank holding company for Sound Community Bank that provides banking and other financial services for consumers and businesses. It accepts various deposits products comprising savings accounts, money market deposit accounts, NOW accounts, demand accounts, and certificates of deposit. The company also offers various loan products, such as loans secured by first and second mortgages on one-to four-family residences; home equity loans comprising fixed-rate loans and variable-rate lines of credit; commercial and multifamily real estate loans; construction loans secured by single-family residences, and commercial and multifamily real estate; land loans; secured and unsecured consumer loans, including new and used manufactured home loans, floating home loans, automobile loans, boat loans, and recreational vehicle loans, and loans secured by deposit accounts; and commercial business loans to finance commercial vehicles and equipment, as well as loans secured by accounts receivable and/or inventory. It operates eight branches offices, including five branches in Seattle Metropolitan Statistical Area, two branches in Clallam County, and one branch in Jefferson County; and two loan production offices in the Madison Park neighborhood of Seattle and Sequim. Sound Financial Bancorp, Inc. was incorporated in 2008 and is headquartered in Seattle, Washington.
Latest SFBC News From Around the Web
Below are the latest news stories about SOUND FINANCIAL BANCORP INC that investors may wish to consider to help them evaluate SFBC as an investment opportunity.
There's A Lot To Like About Sound Financial Bancorp's (NASDAQ:SFBC) Upcoming US$0.19 DividendSound Financial Bancorp, Inc. ( NASDAQ:SFBC ) stock is about to trade ex-dividend in 4 days. The ex-dividend date is... |
STILWELL JOSEPH Acquires Shares in Sound Financial Bancorp IncDespite the significant addition, the trade had no immediate impact on the firm's portfolio. The traded stock now represents 15.24% of the guru's holdings in SFBC. STILWELL JOSEPH (Trades, Portfolio) is a renowned investment firm based in New York. |
STILWELL JOSEPH Acquires Significant Stake in Sound Financial Bancorp IncOn October 25, 2023, investment firm STILWELL JOSEPH (Trades, Portfolio) made a notable addition to its portfolio by acquiring 387,266 shares of Sound Financial Bancorp Inc (NASDAQ:SFBC). This article provides an in-depth analysis of this transaction, the profiles of the guru and the traded company, and the potential implications for both parties. The transaction took place on October 25, 2023, with STILWELL JOSEPH (Trades, Portfolio) adding 2,502 shares of SFBC to its portfolio. |
Sound Financial Bancorp, Inc. Q3 2023 ResultsSEATTLE, Oct. 24, 2023 (GLOBE NEWSWIRE) -- Sound Financial Bancorp, Inc. (the “Company”) (Nasdaq: SFBC), the holding company for Sound Community Bank (the “Bank”), today reported net income of $1.2 million for the quarter ended September 30, 2023, or $0.45 diluted earnings per share, as compared to net income of $2.9 million, or $1.11 diluted earnings per share, for the quarter ended June 30, 2023, and $2.5 million, or $0.97 diluted earnings per share, for the quarter ended September 30, 2022. T |
Investors in Sound Financial Bancorp (NASDAQ:SFBC) have seen respectable returns of 35% over the past three yearsBy buying an index fund, investors can approximate the average market return. But if you buy good businesses at... |
SFBC Price Returns
| 1-mo | -0.47% |
| 3-mo | N/A |
| 6-mo | 8.34% |
| 1-year | 19.41% |
| 3-year | 0.71% |
| 5-year | 35.93% |
| YTD | 10.82% |
| 2023 | 1.30% |
| 2022 | -8.97% |
| 2021 | 41.45% |
| 2020 | -9.42% |
| 2019 | 12.42% |
SFBC Dividends
| Ex-Dividend Date | Type | Payout Amount | Change | ||||||
|---|---|---|---|---|---|---|---|---|---|
| Loading, please wait... | |||||||||
Continue Researching SFBC
Want to do more research on Sound Financial Bancorp Inc's stock and its price? Try the links below:Sound Financial Bancorp Inc (SFBC) Stock Price | Nasdaq
Sound Financial Bancorp Inc (SFBC) Stock Quote, History and News - Yahoo Finance
Sound Financial Bancorp Inc (SFBC) Stock Price and Basic Information | MarketWatch
Loading social stream, please wait...