
Simmons First National Corporation (SFNC): Price and Financial Metrics
SFNC Price/Volume Stats
| Current price | $21.90 | 52-week high | $22.29 |
| Prev. close | $21.81 | 52-week low | $13.36 |
| Day low | $21.56 | Volume | 719,400 |
| Day high | $22.29 | Avg. volume | 506,845 |
| 50-day MA | $18.03 | Dividend yield | 3.91% |
| 200-day MA | $17.96 | Market Cap | 2.75B |
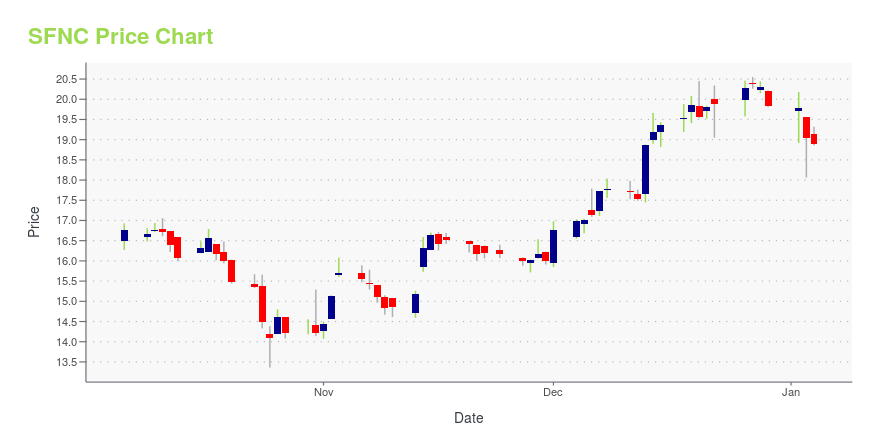
SFNC Stock Price Chart Interactive Chart >
Simmons First National Corporation (SFNC) Company Bio
Simmons First National Corporation provides a range of banking products and services to individual and corporate customers in Arkansas, Missouri, and Kansas. The company was founded in 1903 and is based in Pine Bluff, Arkansas.
Latest SFNC News From Around the Web
Below are the latest news stories about SIMMONS FIRST NATIONAL CORP that investors may wish to consider to help them evaluate SFNC as an investment opportunity.
Simmons First National Corporation Announces Fourth Quarter 2023 Earnings Release Date and Conference CallSimmons First National Corporation (NASDAQ: SFNC) today announced it is scheduled to release fourth quarter 2023 earnings prior to the market opening on Wednesday, January 24, 2024. Management will conduct a live conference call to review this information beginning at 9:00 a.m. Central Time on Wednesday, January 24. Interested parties can listen to the call by dialing toll-free 1-844-481-2779 (North America only) and asking for the Simmons First National Corporation conference call, conference I |
Simmons Bank Helps Customers Save Nearly $5.5 Million in "Change"Simmons Bank announced today its automatic savings program, Round-Up, allowed customers to save nearly $5.5 million during the first eleven months of 2023. More than 26,400 customers utilized the program during this period. Compared to the same timeframe in 2022, dollars saved increased by nearly 6 percent. |
Simmons Bank Presents $30,000 Donation to Junior AchievementSimmons Bank (Simmons) presented a $30,000 donation to Junior Achievement at the Simmons River Market Building in Little Rock. The donation will fund work-readiness and financial and entrepreneurial education for children across Simmons' six-state footprint and was made in honor of the more than 5,500 volunteer hours that associates donated to their local communities during the sixth annual "Simmons Service Month." |
Investar (ISTR) Surges 6.3%: Is This an Indication of Further Gains?Investar (ISTR) saw its shares surge in the last session with trading volume being higher than average. The latest trend in earnings estimate revisions may not translate into further price increase in the near term. |
Simmons First National Corporation (NASDAQ:SFNC) Passed Our Checks, And It's About To Pay A US$0.20 DividendSimmons First National Corporation ( NASDAQ:SFNC ) stock is about to trade ex-dividend in 4 days. Typically, the... |
SFNC Price Returns
| 1-mo | 30.05% |
| 3-mo | 26.74% |
| 6-mo | 10.92% |
| 1-year | 16.95% |
| 3-year | -9.28% |
| 5-year | 1.03% |
| YTD | 13.05% |
| 2023 | -3.96% |
| 2022 | -24.62% |
| 2021 | 40.32% |
| 2020 | -16.10% |
| 2019 | 13.90% |
SFNC Dividends
| Ex-Dividend Date | Type | Payout Amount | Change | ||||||
|---|---|---|---|---|---|---|---|---|---|
| Loading, please wait... | |||||||||
Continue Researching SFNC
Want to see what other sources are saying about Simmons First National Corp's financials and stock price? Try the links below:Simmons First National Corp (SFNC) Stock Price | Nasdaq
Simmons First National Corp (SFNC) Stock Quote, History and News - Yahoo Finance
Simmons First National Corp (SFNC) Stock Price and Basic Information | MarketWatch
Loading social stream, please wait...