
Star Group L.P. (SGU): Price and Financial Metrics
SGU Price/Volume Stats
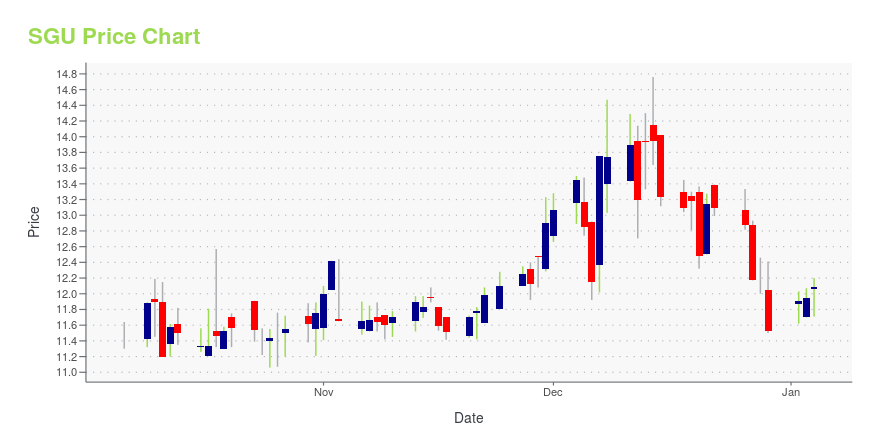
| Current price | $11.40 | 52-week high | $14.76 |
| Prev. close | $11.28 | 52-week low | $9.64 |
| Day low | $11.21 | Volume | 23,308 |
| Day high | $11.46 | Avg. volume | 52,608 |
| 50-day MA | $10.84 | Dividend yield | 6.15% |
| 200-day MA | $11.31 | Market Cap | 401.62M |
SGU Stock Price Chart Interactive Chart >
Star Group L.P. (SGU) Company Bio
StarGas Partners LP operates as a home heating oil and propane distributor and services provider to residential and commercial customers in the United States. The company was founded in 1995 and is based in Stamford, Connecticut.
Latest SGU News From Around the Web
Below are the latest news stories about STAR GROUP LP that investors may wish to consider to help them evaluate SGU as an investment opportunity.
6 A-Rated Utilities Stocks You Won’t RegretEven when the market is uncertain and energy prices are depressed, these utilities stocks brought in great returns and many pay a dividend. |
Star Group LP (SGU) Faces Decline in Q4 Revenue Amid Market VolatilityAdjusted EBITDA Sees Slight Increase Despite Lower Sales Volume |
Star Group, L.P. Reports Fiscal 2023 Fourth Quarter ResultsSTAMFORD, Conn., Dec. 06, 2023 (GLOBE NEWSWIRE) -- Star Group, L.P. (the "Company" or "Star") (NYSE:SGU), a home energy distributor and services provider, today announced financial results for the fiscal 2023 fourth quarter and year ended September 30, 2023. Three Months Ended September 30, 2023 Compared to the Three Months Ended September 30, 2022For the fiscal 2023 fourth quarter, Star reported a 10.0 percent decrease in total revenue to $266.9 million compared with $296.6 million in the prior |
Star Group, L.P. to Host Fiscal 2023 Fourth Quarter Webcast and Conference Call December 7, 2023STAMFORD, Conn., Dec. 01, 2023 (GLOBE NEWSWIRE) -- Star Group, L.P. (the “Company” or “Star”) (NYSE: SGU), a leading home energy distributor and services provider, today announced that it will release its fiscal 2023 fourth quarter and year end results after the close of trading on December 6, 2023. Members of Star's management team will host a webcast and conference call at 11:00 a.m. Eastern Time the following day, December 7, 2023, to review the three and twelve months ended September 30, 202 |
12 Best Dividend Stocks Under $20In this article, we discuss 12 best dividend stocks under $20. You can skip our detailed analysis of dividend stocks and their performance in the past, and go directly to read 5 Best Dividend Stocks Under $20. In 2023, dividend-paying stocks faced difficulties, but experienced investors understand that short-term setbacks don’t deter them. They know […] |
SGU Price Returns
| 1-mo | 5.65% |
| 3-mo | 2.70% |
| 6-mo | 3.08% |
| 1-year | -6.73% |
| 3-year | 14.40% |
| 5-year | 52.74% |
| YTD | 1.84% |
| 2023 | 0.65% |
| 2022 | 18.90% |
| 2021 | 20.46% |
| 2020 | 5.46% |
| 2019 | 6.70% |
SGU Dividends
| Ex-Dividend Date | Type | Payout Amount | Change | ||||||
|---|---|---|---|---|---|---|---|---|---|
| Loading, please wait... | |||||||||
Continue Researching SGU
Want to see what other sources are saying about Star Group Lp's financials and stock price? Try the links below:Star Group Lp (SGU) Stock Price | Nasdaq
Star Group Lp (SGU) Stock Quote, History and News - Yahoo Finance
Star Group Lp (SGU) Stock Price and Basic Information | MarketWatch
Loading social stream, please wait...