Shore Bancshares Inc (SHBI): Price and Financial Metrics

Shore Bancshares Inc (SHBI): $11.78

0.04 (-0.34%)

POWR Rating

Component Grades

Momentum

C

Stability

C

Sentiment

Quality

C

SHBI Price/Volume Stats

Current price $11.78 52-week high $20.85
Prev. close $11.82 52-week low $9.66
Day low $11.69 Volume 65,600
Day high $11.89 Avg. volume 87,454
50-day MA $10.85 Dividend yield 4.02%
200-day MA $12.32 Market Cap 390.46M

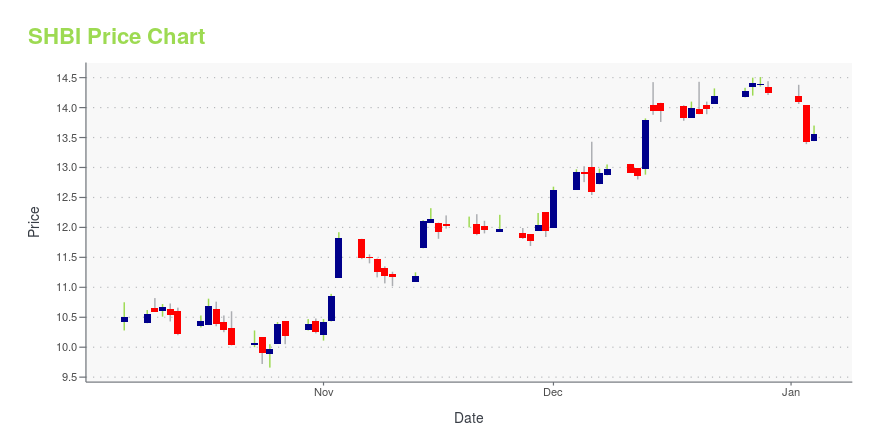
SHBI Stock Price Chart Interactive Chart >

SHBI POWR Grades

  • SHBI scores best on the Sentiment dimension, with a Sentiment rank ahead of 60.75% of US stocks.
  • The strongest trend for SHBI is in Sentiment, which has been heading up over the past 177 days.
  • SHBI's current lowest rank is in the Quality metric (where it is better than 16.3% of US stocks).

SHBI Stock Summary

  • Equity multiplier, or assets relative to shareholders' equity, comes in at 9.76 for SHORE BANCSHARES INC; that's greater than it is for 89.34% of US stocks.
  • With a year-over-year growth in debt of 420.07%, SHORE BANCSHARES INC's debt growth rate surpasses 97.47% of about US stocks.
  • SHORE BANCSHARES INC's shareholder yield -- a measure of how much capital is returned to stockholders via dividends and buybacks -- is -69.43%, greater than the shareholder yield of merely 8.16% of stocks in our set.
  • Stocks that are quantitatively similar to SHBI, based on their financial statements, market capitalization, and price volatility, are HBCP, ORRF, VBFC, PGC, and SBCF.
  • Visit SHBI's SEC page to see the company's official filings. To visit the company's web site, go to shore-bancshares--inc-.

SHBI Valuation Summary

  • SHBI's price/earnings ratio is 13; this is 36.84% higher than that of the median Financial Services stock.
  • Over the past 243 months, SHBI's price/sales ratio has gone down 3.5.

Below are key valuation metrics over time for SHBI.

Stock Date P/S P/B P/E EV/EBIT
SHBI 2023-11-10 3.1 1.0 13.0 16.8
SHBI 2023-11-09 3.1 1.0 13.0 16.8
SHBI 2023-11-08 3.1 1.0 13.1 16.9
SHBI 2023-11-07 3.1 1.0 13.3 17.1
SHBI 2023-11-06 3.1 1.0 13.3 17.1
SHBI 2023-11-03 3.2 1.1 13.7 17.4

SHBI Growth Metrics

    The 2 year net income to common stockholders growth rate now stands at 9.13%.
  • The 3 year net income to common stockholders growth rate now stands at -31.22%.
  • The 2 year price growth rate now stands at 110.35%.
Over the past 52 months, SHBI's revenue has gone up $51,509,000.

The table below shows SHBI's growth in key financial areas (numbers in millions of US dollars).

Date Revenue Operating Cash Flow Net Income to Common Stock
2022-09-30 117.602 26.982 25.493
2022-06-30 103.826 25.008 20.451
2022-03-31 89.931 13.8 16.983
2021-12-31 77.986 -7.503 15.368
2021-09-30 66.258 19.462 16.531
2021-06-30 62.414 17.817 15.306

SHBI's Quality Factors

The “Quality” component of the POWR Ratings focuses on 31 different factors of a companies fundamentals and operational strength. Here are some key insights as we drill into the specifics of these quality attributes.
  • SHBI has a Quality Grade of C, ranking ahead of 29.63% of graded US stocks.
  • SHBI's asset turnover comes in at 0.032 -- ranking 338th of 431 Banking stocks.
  • ATLC, PBIP, and LMFA are the stocks whose asset turnover ratios are most correlated with SHBI.

The table below shows SHBI's key quality metrics over time.

Period Asset Turnover Gross Margin ROIC
2021-06-30 0.032 1 0.012
2021-03-31 0.032 1 0.013
2020-12-31 0.034 1 0.013
2020-09-30 0.035 1 0.014
2020-06-30 0.037 1 0.015
2020-03-31 0.038 1 0.014

SHBI Price Target

For more insight on analysts targets of SHBI, see our SHBI price target page. And for a list of of all stocks sorted by upside potential based on analyst target price, see our Top Price Target page.

Average Price Target $18.50 Average Broker Recommendation 1.5 (Moderate Buy)

Shore Bancshares Inc (SHBI) Company Bio


Shore Bancshares, Inc. provides various commercial banking products and services to individuals, businesses, and other organizations in Maryland and Delaware. The company was founded in 1876 and is based in Easton, Maryland.


SHBI Latest News Stream


Event/Time News Detail
Loading, please wait...

SHBI Latest Social Stream


Loading social stream, please wait...

View Full SHBI Social Stream

Latest SHBI News From Around the Web

Below are the latest news stories about SHORE BANCSHARES INC that investors may wish to consider to help them evaluate SHBI as an investment opportunity.

Dividend Investors: Don't Be Too Quick To Buy Shore Bancshares, Inc. (NASDAQ:SHBI) For Its Upcoming Dividend

It looks like Shore Bancshares, Inc. ( NASDAQ:SHBI ) is about to go ex-dividend in the next three days. The ex-dividend...

Yahoo | November 12, 2023

Shore Bancshares, Inc. Reports Quarterly Dividend of $0.12 Per Share

Shore Bancshares, Inc. (NASDAQ - SHBI) announced that the Board of Directors has declared a quarterly common stock dividend in the amount of $0.12 per share, payable November 30, 2023 to stockholders of record on November 18, 2023.

Yahoo | November 7, 2023

Shore Bancshares Inc (SHBI) Reports Q3 2023 Net Loss of $6.4 Million Due to Merger Activity

Despite the loss, the company highlights successful merger completion and robust deposit growth

Yahoo | November 3, 2023

Shore Bancshares, Inc. Reports Third Quarter 2023 Net Loss of $6.4 million Due to One-Time Merger Related Activity

Shore Bancshares, Inc. (NASDAQ - SHBI) (the "Company" or "Shore Bancshares"), the holding company for Shore United Bank N.A. (the "Bank" or "SUB") reported financial results for the third quarter and first nine months of 2023. Third quarter results include the successful completion of the merger (the "merger") on July 1, 2023 with The Community Financial Corporation with total assets exceeding $5.7 billion for the combined company. In the third quarter of 2023, the Company reported a net loss of

Yahoo | November 1, 2023

Shore Bancshares (SHBI) Expected to Beat Earnings Estimates: Can the Stock Move Higher?

Shore Bancshares (SHBI) possesses the right combination of the two key ingredients for a likely earnings beat in its upcoming report. Get prepared with the key expectations.

Yahoo | October 19, 2023

Read More 'SHBI' Stories Here

SHBI Price Returns

1-mo 14.62%
3-mo 7.38%
6-mo 3.37%
1-year -37.82%
3-year -7.17%
5-year -13.65%
YTD -29.79%
2022 -14.36%
2021 46.88%
2020 -12.26%
2019 22.62%
2018 -11.34%

SHBI Dividends

Ex-Dividend Date Type Payout Amount Change
Loading, please wait...
View Full SHBI Dividend History

Continue Researching SHBI

Want to see what other sources are saying about Shore Bancshares Inc's financials and stock price? Try the links below:

Shore Bancshares Inc (SHBI) Stock Price | Nasdaq
Shore Bancshares Inc (SHBI) Stock Quote, History and News - Yahoo Finance
Shore Bancshares Inc (SHBI) Stock Price and Basic Information | MarketWatch

Get Free Updates

Join thousands of investors who get the latest news, insights and top rated picks from StockNews.com!