
J.M. Smucker Co. (SJM): Price and Financial Metrics
SJM Price/Volume Stats
| Current price | $118.19 | 52-week high | $153.00 |
| Prev. close | $116.06 | 52-week low | $105.69 |
| Day low | $116.01 | Volume | 754,900 |
| Day high | $118.39 | Avg. volume | 1,241,321 |
| 50-day MA | $112.39 | Dividend yield | 3.68% |
| 200-day MA | $118.06 | Market Cap | 12.55B |
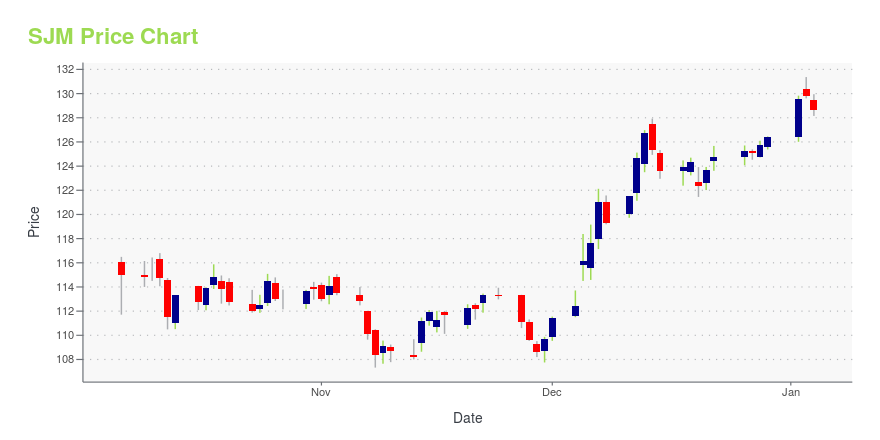
SJM Stock Price Chart Interactive Chart >
J.M. Smucker Co. (SJM) Company Bio
The J. M. Smucker Company, also known as Smuckers, is an American manufacturer of food and beverage products. Headquartered in Orrville, Ohio, the company was founded in 1897 as a maker of apple butter. J.M. Smucker currently has three major business units: consumer foods, pet foods, and coffee. Its flagship brand, Smucker's, produces fruit preserves, peanut butter, syrups, frozen crustless sandwiches, and ice cream toppings. (Source:Wikipedia)
Latest SJM News From Around the Web
Below are the latest news stories about J M SMUCKER CO that investors may wish to consider to help them evaluate SJM as an investment opportunity.
Top 15 Value Stocks to Buy for 2024In this article, we discuss top 15 value stocks to buy for 2024 picked by Joel Greenblatt. To skip the details about Mr. Greenblatt’s life, portfolio performance, and investment strategy, go directly to Top 5 Value Stocks to Buy for 2024. Investing offers an exciting and effective way of growing wealth over time. Value investing is […] |
Early Retirement Portfolio: 16 Stocks to Live Off Dividends RevisitedIn this article, we discuss the best dividend stocks for an early retirement portfolio. You can skip our detailed analysis of dividend stocks and their performance in the past, and go directly to read Early Retirement Portfolio: 5 Stocks to Live Off Dividends Revisited. As investors approach the threshold of retirement, the quest for financial […] |
How Food Stocks Spoiled in 2023Companies making packaged food were among the most notable U.S. stock underperformers of the year, and the causes were many. Next year might look better. |
Mission Produce (AVO) Reports Earnings Tomorrow. What To ExpectAvocado company Mission Produce (NASDAQ:AVO) will be reporting earnings tomorrow afternoon. Here's what to look for. |
Clorox's (CLX) Growth Strategies Seem Encouraging: Here's WhyClorox's (CLX) IGNITE strategy bodes well. The company's pricing and cost-saving initiatives are aiding margins and, in turn, profitability. |
SJM Price Returns
| 1-mo | 8.78% |
| 3-mo | 5.01% |
| 6-mo | -8.57% |
| 1-year | -18.96% |
| 3-year | -0.90% |
| 5-year | 20.52% |
| YTD | -4.80% |
| 2023 | -17.79% |
| 2022 | 20.06% |
| 2021 | 21.05% |
| 2020 | 14.50% |
| 2019 | 14.90% |
SJM Dividends
| Ex-Dividend Date | Type | Payout Amount | Change | ||||||
|---|---|---|---|---|---|---|---|---|---|
| Loading, please wait... | |||||||||
Continue Researching SJM
Want to see what other sources are saying about J M SMUCKER Co's financials and stock price? Try the links below:J M SMUCKER Co (SJM) Stock Price | Nasdaq
J M SMUCKER Co (SJM) Stock Quote, History and News - Yahoo Finance
J M SMUCKER Co (SJM) Stock Price and Basic Information | MarketWatch
Loading social stream, please wait...