Schlumberger Ltd. (SLB): Price and Financial Metrics
GET POWR RATINGS... FREE!
SLB POWR Grades
- Momentum is the dimension where SLB ranks best; there it ranks ahead of 99.67% of US stocks.
- The strongest trend for SLB is in Momentum, which has been heading up over the past 178 days.
- SLB's current lowest rank is in the Value metric (where it is better than 19.73% of US stocks).
SLB Stock Summary
- SLB has a market capitalization of $63,454,021,823 -- more than approximately 96.79% of US stocks.
- SCHLUMBERGER LIMITED's stock had its IPO on January 1, 1986, making it an older stock than 93.42% of US equities in our set.
- The ratio of debt to operating expenses for SCHLUMBERGER LIMITED is higher than it is for about 93.78% of US stocks.
- Stocks that are quantitatively similar to SLB, based on their financial statements, market capitalization, and price volatility, are MRVL, ANET, TEAM, ORMP, and INMB.
- SLB's SEC filings can be seen here. And to visit SCHLUMBERGER LIMITED's official web site, go to www.slb.com.
SLB Valuation Summary
- In comparison to the median Energy stock, SLB's price/sales ratio is 91.67% higher, now standing at 2.3.
- Over the past 243 months, SLB's price/sales ratio has gone up 0.7.
Below are key valuation metrics over time for SLB.
Stock | Date | P/S | P/B | P/E | EV/EBIT |
---|---|---|---|---|---|
SLB | 2023-03-17 | 2.3 | 3.6 | 18.4 | 15.7 |
SLB | 2023-03-16 | 2.3 | 3.7 | 19.1 | 16.2 |
SLB | 2023-03-15 | 2.3 | 3.6 | 18.7 | 15.9 |
SLB | 2023-03-14 | 2.5 | 4.0 | 20.4 | 17.1 |
SLB | 2023-03-13 | 2.5 | 3.9 | 20.2 | 17.0 |
SLB | 2023-03-10 | 2.6 | 4.1 | 21.0 | 17.6 |
SLB Growth Metrics
- Its year over year cash and equivalents growth rate is now at 26.18%.
- The 4 year net income to common stockholders growth rate now stands at -838.95%.
- Its 5 year net income to common stockholders growth rate is now at -838.95%.

The table below shows SLB's growth in key financial areas (numbers in millions of US dollars).
Date | Revenue | Operating Cash Flow | Net Income to Common Stock |
---|---|---|---|
2022-12-31 | 28,091 | 3,720 | 3,441 |
2022-09-30 | 26,437 | 4,038 | 2,977 |
2022-06-30 | 24,807 | 3,541 | 2,620 |
2022-03-31 | 23,668 | 4,353 | 2,092 |
2021-12-31 | 22,929 | 4,651 | 1,881 |
2021-09-30 | 22,236 | 3,597 | 1,654 |
SLB's Quality Factors
The “Quality” component of the POWR Ratings focuses on 31 different factors of a companies fundamentals and operational strength. Here are some key insights as we drill into the specifics of these quality attributes.- SLB has a Quality Grade of B, ranking ahead of 79.74% of graded US stocks.
- SLB's asset turnover comes in at 0.534 -- ranking 47th of 137 Petroleum and Natural Gas stocks.
- KWR, NGS, and HESM are the stocks whose asset turnover ratios are most correlated with SLB.
The table below shows SLB's key quality metrics over time.
Period | Asset Turnover | Gross Margin | ROIC |
---|---|---|---|
2021-09-30 | 0.534 | 0.147 | 0.086 |
2021-06-30 | 0.511 | 0.135 | 0.060 |
2021-03-31 | 0.494 | 0.116 | -0.073 |
2020-12-31 | 0.525 | 0.110 | -0.335 |
2020-09-30 | 0.543 | 0.114 | -0.329 |
2020-06-30 | 0.570 | 0.119 | -0.667 |
SLB Price Target
For more insight on analysts targets of SLB, see our SLB price target page. And for a list of of all stocks sorted by upside potential based on analyst target price, see our Top Price Target page.
Average Price Target | $36.23 | Average Broker Recommendation | 1.45 (Moderate Buy) |
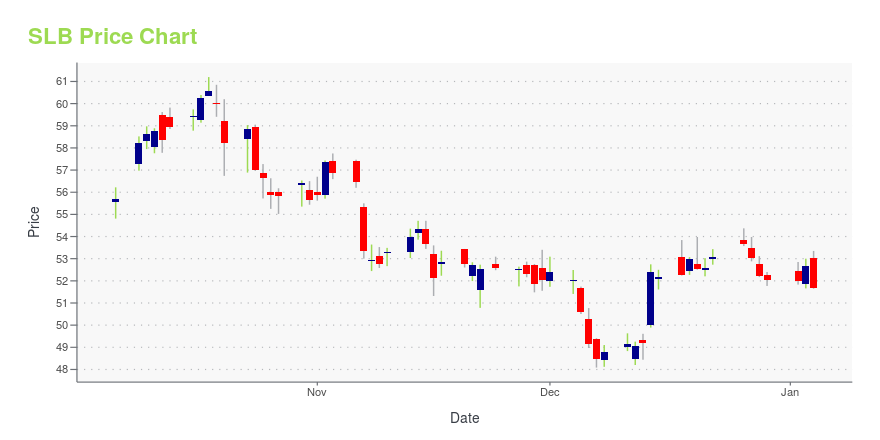
SLB Stock Price Chart Interactive Chart >
SLB Price/Volume Stats
Current price | $46.22 | 52-week high | $62.78 |
Prev. close | $44.68 | 52-week low | $30.65 |
Day low | $44.70 | Volume | 10,494,752 |
Day high | $46.55 | Avg. volume | 9,574,343 |
50-day MA | $54.19 | Dividend yield | 2.17% |
200-day MA | $45.77 | Market Cap | 66.01B |
Schlumberger Ltd. (SLB) Company Bio
Schlumberger is the world's leading supplier of technology, integrated project management and information solutions to customers working in the oil and gas industry worldwide. The company was founded in 1926 and is based in Paris, France.
Latest SLB News From Around the Web
Below are the latest news stories about SCHLUMBERGER LIMITED that investors may wish to consider to help them evaluate SLB as an investment opportunity.
Schlumberger (SLB) Gains But Lags Market: What You Should KnowSchlumberger (SLB) closed at $49.36 in the latest trading session, marking a +1.06% move from the prior day. |
Schlumberger (NYSE:SLB) pulls back 12% this week, but still delivers shareholders stellar 53% CAGR over 3 yearsSchlumberger Limited ( NYSE:SLB ) shareholders might be concerned after seeing the share price drop 13% in the last... |
Wall Street Bulls Look Optimistic About Schlumberger (SLB): Should You Buy?According to the average brokerage recommendation (ABR), one should invest in Schlumberger (SLB). It is debatable whether this highly sought-after metric is effective because Wall Street analysts' recommendations tend to be overly optimistic. Would it be worth investing in the stock? |
Is Schlumberger (NYSE:SLB) Using Too Much Debt?David Iben put it well when he said, 'Volatility is not a risk we care about. What we care about is avoiding the... |
Schlumberger (SLB) Stock Sinks As Market Gains: What You Should KnowSchlumberger (SLB) closed at $55.35 in the latest trading session, marking a -1.14% move from the prior day. |
SLB Price Returns
1-mo | -13.35% |
3-mo | -10.28% |
6-mo | 24.00% |
1-year | 18.26% |
3-year | 242.40% |
5-year | -20.56% |
YTD | -13.13% |
2022 | 81.15% |
2021 | 39.60% |
2020 | -43.81% |
2019 | 17.73% |
2018 | -44.66% |
SLB Dividends
Ex-Dividend Date | Type | Payout Amount | Change | ||||||
---|---|---|---|---|---|---|---|---|---|
Loading, please wait... |
Continue Researching SLB
Here are a few links from around the web to help you further your research on Schlumberger Limited's stock as an investment opportunity:Schlumberger Limited (SLB) Stock Price | Nasdaq
Schlumberger Limited (SLB) Stock Quote, History and News - Yahoo Finance
Schlumberger Limited (SLB) Stock Price and Basic Information | MarketWatch
Loading social stream, please wait...