SL Green Realty Corp (SLG): Price and Financial Metrics
GET POWR RATINGS... FREE!
SLG POWR Grades
- SLG scores best on the Momentum dimension, with a Momentum rank ahead of 84.89% of US stocks.
- SLG's strongest trending metric is Growth; it's been moving up over the last 179 days.
- SLG ranks lowest in Sentiment; there it ranks in the 2nd percentile.
SLG Stock Summary
- The ratio of debt to operating expenses for Sl Green Realty Corp is higher than it is for about 94.59% of US stocks.
- Revenue growth over the past 12 months for Sl Green Realty Corp comes in at -19.83%, a number that bests only 7.3% of the US stocks we're tracking.
- Sl Green Realty Corp's shareholder yield -- a measure of how much capital is returned to stockholders via dividends and buybacks -- is 22.35%, greater than the shareholder yield of 92.18% of stocks in our set.
- Stocks that are quantitatively similar to SLG, based on their financial statements, market capitalization, and price volatility, are NMM, FR, GOGL, ATCO, and FRO.
- SLG's SEC filings can be seen here. And to visit Sl Green Realty Corp's official web site, go to www.slgreen.com.
SLG Valuation Summary
- SLG's EV/EBIT ratio is 25; this is 34.98% lower than that of the median Real Estate stock.
- Over the past 243 months, SLG's price/sales ratio has gone up 1.7.
- Over the past 243 months, SLG's EV/EBIT ratio has gone up 13.8.
Below are key valuation metrics over time for SLG.
Stock | Date | P/S | P/B | P/E | EV/EBIT |
---|---|---|---|---|---|
SLG | 2021-09-02 | 5.1 | 1 | 16.9 | 25.0 |
SLG | 2021-09-01 | 5.2 | 1 | 17.0 | 25.1 |
SLG | 2021-08-31 | 5.1 | 1 | 16.6 | 24.8 |
SLG | 2021-08-30 | 5.0 | 1 | 16.6 | 24.8 |
SLG | 2021-08-27 | 5.1 | 1 | 16.8 | 25.0 |
SLG | 2021-08-26 | 5.1 | 1 | 16.6 | 24.8 |
SLG Growth Metrics
- Its 4 year price growth rate is now at -57.13%.
- Its 5 year price growth rate is now at -57.13%.
- Its 5 year cash and equivalents growth rate is now at 25.17%.

The table below shows SLG's growth in key financial areas (numbers in millions of US dollars).
Date | Revenue | Operating Cash Flow | Net Income to Common Stock |
---|---|---|---|
2021-12-31 | 843.991 | 255.979 | 434.804 |
2021-09-30 | 884.308 | 417.305 | 657.074 |
2021-06-30 | 928.951 | 433.195 | 282.728 |
2021-03-31 | 964.543 | 530.812 | 233.84 |
2020-12-31 | 1,052.744 | 554.236 | 356.105 |
2020-09-30 | 1,125.928 | 404.983 | 202.536 |
SLG's Quality Factors
The “Quality” component of the POWR Ratings focuses on 31 different factors of a companies fundamentals and operational strength. Here are some key insights as we drill into the specifics of these quality attributes.- SLG has a Quality Grade of C, ranking ahead of 74.93% of graded US stocks.
- SLG's asset turnover comes in at 0.079 -- ranking 260th of 444 Trading stocks.
- PTMN, PIPR, and SAR are the stocks whose asset turnover ratios are most correlated with SLG.
The table below shows SLG's key quality metrics over time.
Period | Asset Turnover | Gross Margin | ROIC |
---|---|---|---|
2021-06-30 | 0.079 | 0.621 | 0.023 |
2021-03-31 | 0.079 | 0.641 | 0.020 |
2020-12-31 | 0.084 | 0.658 | 0.027 |
2020-09-30 | 0.088 | 0.663 | 0.019 |
2020-06-30 | 0.091 | 0.665 | 0.021 |
2020-03-31 | 0.094 | 0.663 | 0.027 |
SLG Price Target
For more insight on analysts targets of SLG, see our SLG price target page. And for a list of of all stocks sorted by upside potential based on analyst target price, see our Top Price Target page.
Average Price Target | $80.19 | Average Broker Recommendation | 1.89 (Hold) |
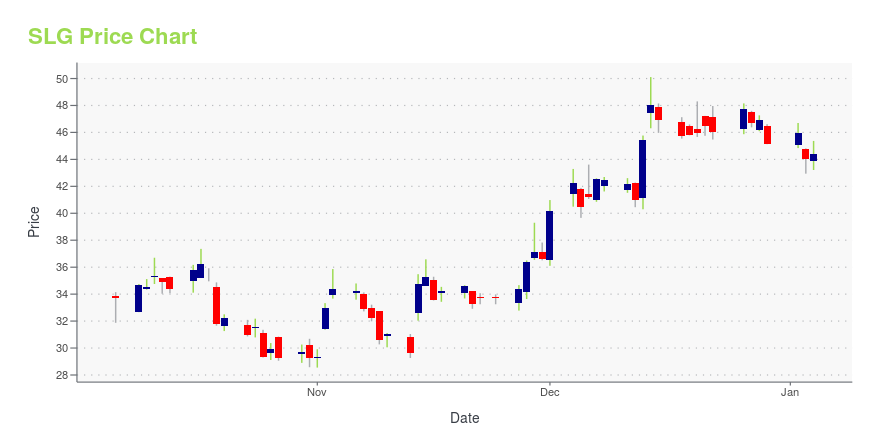
SLG Stock Price Chart Interactive Chart >
SLG Price/Volume Stats
Current price | $62.62 | 52-week high | $85.65 |
Prev. close | $62.38 | 52-week low | $59.09 |
Day low | $62.11 | Volume | 755,100 |
Day high | $62.76 | Avg. volume | 897,164 |
50-day MA | $72.13 | Dividend yield | 5.96% |
200-day MA | $73.61 | Market Cap | 4.02B |
SL Green Realty Corp (SLG) Company Bio
SL Green Realty Corporation primarily invests in commercial office and retail properties. The company was founded in 1970 and is based in New York, New York.
Latest SLG News From Around the Web
Below are the latest news stories about Sl Green Realty Corp that investors may wish to consider to help them evaluate SLG as an investment opportunity.
Why Is SL Green (SLG) Up 11.6% Since Last Earnings Report?SL Green (SLG) reported earnings 30 days ago. What's next for the stock? We take a look at earnings estimates for some clues. |
SL Green Realty Corp. Announces Common Stock DividendNEW YORK, Feb. 22, 2022 (GLOBE NEWSWIRE) -- SL Green Realty Corp. (NYSE:SLG), Manhattan’s largest office landlord, today announced that its board of directors has declared a monthly ordinary dividend of $0.3108 per share of common stock. The dividend is payable in cash on March 15, 2022 to shareholders of record at the close of business on February 28, 2022. About SL Green Realty Corp. SL Green Realty Corp., Manhattan's largest office landlord, is a fully integrated real estate investment trust, |
This Office REIT Is Benefiting From the Bitcoin BoomThere have been a lot of questions surrounding the future of office space. Many companies plan to allow more of their employees to work remotely in the future, either permanently or in a hybrid model. |
SL Green Realty Corp. Announces Date of 2022 Annual Meeting of StockholdersNEW YORK, Feb. 15, 2022 (GLOBE NEWSWIRE) -- SL Green Realty Corp. (NYSE:SLG) (the “Company”), Manhattan’s largest office landlord, today announced that the Company will hold its 2022 Annual Meeting of Stockholders (the “Annual Meeting”) on Wednesday, June 1, 2022. The board of directors established the close of business on Thursday, March 31, 2022, as the record date for determining stockholders entitled to receive notice of and vote at the Annual Meeting, which will take place in-person in the |
3 Under-the-Radar Dividend Growth Stocks You Won't Want to OverlookWith more than 300 companies on this list, it's easy to overlook some high-quality dividend growth stocks. Three that might have flown under the radar of dividend investors are Brookfield Renewable (NYSE: BEP)(NYSE: BEPC), Brookfield Infrastructure (NYSE: BIP)(NYSE: BIPC), and SL Green Realty (NYSE: SLG). |
SLG Price Returns
1-mo | -13.29% |
3-mo | -20.99% |
6-mo | -5.63% |
1-year | -13.98% |
3-year | -9.03% |
5-year | -17.44% |
YTD | -10.77% |
2021 | 30.91% |
2020 | -29.06% |
2019 | 20.96% |
2018 | -18.80% |
2017 | -3.25% |
SLG Dividends
Ex-Dividend Date | Type | Payout Amount | Change | ||||||
---|---|---|---|---|---|---|---|---|---|
Loading, please wait... |
Continue Researching SLG
Want to see what other sources are saying about Sl Green Realty Corp's financials and stock price? Try the links below:Sl Green Realty Corp (SLG) Stock Price | Nasdaq
Sl Green Realty Corp (SLG) Stock Quote, History and News - Yahoo Finance
Sl Green Realty Corp (SLG) Stock Price and Basic Information | MarketWatch
Loading social stream, please wait...