
SLM Corporation (SLM): Price and Financial Metrics
SLM Price/Volume Stats
| Current price | $22.73 | 52-week high | $23.95 |
| Prev. close | $23.00 | 52-week low | $12.26 |
| Day low | $22.64 | Volume | 1,919,754 |
| Day high | $23.10 | Avg. volume | 1,944,948 |
| 50-day MA | $21.29 | Dividend yield | 1.87% |
| 200-day MA | $19.18 | Market Cap | 4.99B |
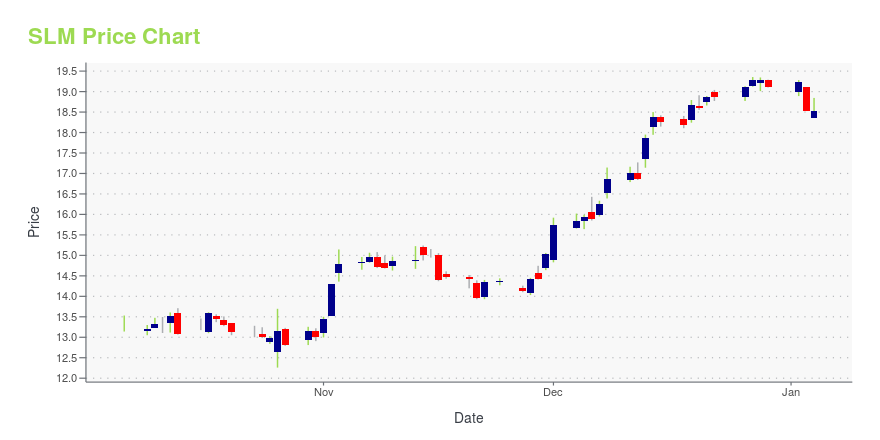
SLM Stock Price Chart Interactive Chart >
SLM Corporation (SLM) Company Bio
SLM Corporation offers private education loans to students and their families. The company was founded in 1972 and is based in Newark, Delaware.
Latest SLM News From Around the Web
Below are the latest news stories about SLM CORP that investors may wish to consider to help them evaluate SLM as an investment opportunity.
Loan Origination Growth Aids Sallie Mae (SLM) Despite High DebtSallie Mae's (SLM) loan originations are likely to gain from secular growth trends in the private student lending industry. Yet, high debt seems unmanageable relative to a smaller cash position. |
Sallie Mae And Delaware State University Announce Partnership to Address Barriers to College CompletionNEWARK, Del., December 11, 2023--Sallie Mae® today announced a $1 million research endowment to Delaware State University (DSU) to help close the college completion gap. The grant from The Sallie Mae Fund will support a comprehensive three-year "Persistence and Completion Pilot Program" that will study and identify barriers to degree completion, help students return to school and complete, and help advance policy recommendations and best practices to enhance student re-engagement. |
New, Streamlined FAFSA® Available Dec. 31: What Families Should Do Now to Get Prepared and Why Filing As Soon As Possible Is So ImportantNEWARK, Del., December 04, 2023--The Free Application for Federal Student Aid (FAFSA®) is the gateway to accessing more than $100 billion in grants, scholarships, and federal financial aid for higher education, and a new, streamlined application will be available on Dec. 31. Now is the time for families to get prepared to complete this all-important form, and Sallie Mae has a free, step-by-step guide to help families get in line for free money for higher education. |
SLM Corp's Dividend AnalysisSLM Corp (NASDAQ:SLM) recently announced a dividend of $0.11 per share, payable on 2023-12-15, with the ex-dividend date set for 2023-12-01. As investors look forward to this upcoming payment, the spotlight also shines on the company's dividend history, yield, and growth rates. Using the data from GuruFocus, let's look into SLM Corp's dividend performance and assess its sustainability. |
Sallie Mae to Host Investor Forum on Dec. 12NEWARK, Del., November 28, 2023--Sallie Mae® (Nasdaq: SLM), formally SLM Corporation, will host an investor forum on Tuesday, Dec. 12, 2023 at 4:30 p.m. ET to discuss the evolution of its balance sheet and capital allocation strategy. |
SLM Price Returns
| 1-mo | 10.66% |
| 3-mo | 4.89% |
| 6-mo | 16.27% |
| 1-year | 49.03% |
| 3-year | 30.95% |
| 5-year | 171.33% |
| YTD | 20.77% |
| 2023 | 18.70% |
| 2022 | -13.47% |
| 2021 | 60.54% |
| 2020 | 40.90% |
| 2019 | 8.60% |
SLM Dividends
| Ex-Dividend Date | Type | Payout Amount | Change | ||||||
|---|---|---|---|---|---|---|---|---|---|
| Loading, please wait... | |||||||||
Continue Researching SLM
Here are a few links from around the web to help you further your research on SLM Corp's stock as an investment opportunity:SLM Corp (SLM) Stock Price | Nasdaq
SLM Corp (SLM) Stock Quote, History and News - Yahoo Finance
SLM Corp (SLM) Stock Price and Basic Information | MarketWatch
Loading social stream, please wait...