
Summit Financial Group, Inc. (SMMF): Price and Financial Metrics
SMMF Price/Volume Stats
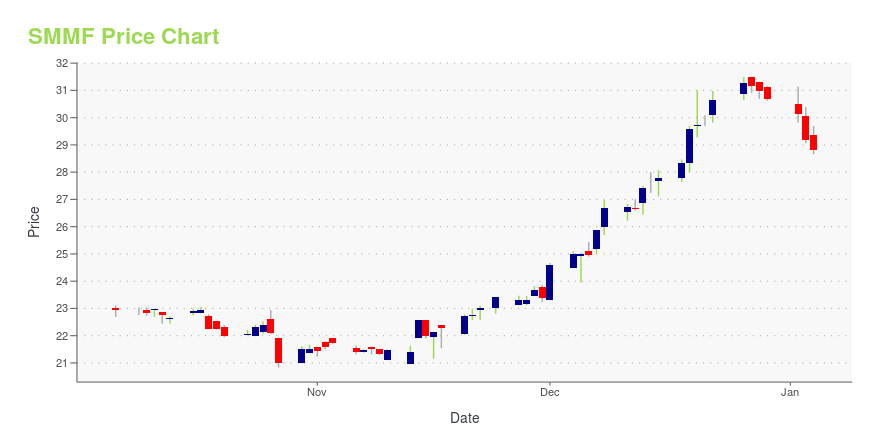
| Current price | $25.70 | 52-week high | $31.49 |
| Prev. close | $26.36 | 52-week low | $17.06 |
| Day low | $25.36 | Volume | 278,100 |
| Day high | $26.42 | Avg. volume | 27,319 |
| 50-day MA | $26.22 | Dividend yield | 3.42% |
| 200-day MA | $25.26 | Market Cap | 377.38M |
SMMF Stock Price Chart Interactive Chart >
Summit Financial Group, Inc. (SMMF) Company Bio
Summit Financial Group, Inc. provides community banking and other financial services to individuals and businesses primarily in the Eastern Panhandle and South Central regions of West Virginia, and the Northern region of Virginia. The company was founded in 1987 and is based in Moorefield, West Virginia.
Latest SMMF News From Around the Web
Below are the latest news stories about SUMMIT FINANCIAL GROUP INC that investors may wish to consider to help them evaluate SMMF as an investment opportunity.
Burke & Herbert Financial Services Corp. and Summit Financial Group, Inc. Announce Receipt of Shareholder Approval for MergerBurke & Herbert Financial Services Corp. ("Burke & Herbert") (Nasdaq: BHRB) and Summit Financial Group, Inc. ("Summit") (Nasdaq: SMMF) today announced that at special meetings of their respective shareholders held on December 6, 2023, Burke & Herbert and Summit shareholders approved the merger of Summit with and into Burke & Herbert, with Burke & Herbert as the surviving corporation pursuant to the Agreement and Plan of Reorganization, dated as of August 24, 2023, by and between Burke & Herbert |
Best Value Stocks to Buy for December 5thSMMF, PK and OSBC made it to the Zacks Rank #1 (Strong Buy) value stocks list on December 5, 2023. |
Best Income Stocks to Buy for December 5thUL, SMMF and TM made it to the Zacks Rank #1 (Strong Buy) income stocks list on December 5, 2023. |
Should Value Investors Buy Summit Financial Group (SMMF) Stock?Here at Zacks, our focus is on the proven Zacks Rank system, which emphasizes earnings estimates and estimate revisions to find great stocks. Nevertheless, we are always paying attention to the latest value, growth, and momentum trends to underscore strong picks. |
Summit Financial Group, Inc. Announces Q4 Common Dividend of $0.22 Per ShareMOOREFIELD, W.Va., Nov. 28, 2023 (GLOBE NEWSWIRE) -- Summit Financial Group, Inc. (“Summit”) (NASDAQ: SMMF) announces its Board of Directors recently declared a fourth quarter 2023 dividend of $0.22 per share payable on December 29, 2023 to common shareholders of record as of the close of business on December 15, 2023. Summit Financial Group, Inc. is the $4.6 billion financial holding company for Summit Community Bank, Inc. Its talented bankers serve commercial and individual clients throughout |
SMMF Price Returns
| 1-mo | N/A |
| 3-mo | -6.38% |
| 6-mo | -11.30% |
| 1-year | 13.22% |
| 3-year | 25.04% |
| 5-year | 10.04% |
| YTD | -15.55% |
| 2023 | 27.86% |
| 2022 | -6.68% |
| 2021 | 27.84% |
| 2020 | -15.18% |
| 2019 | 43.47% |
SMMF Dividends
| Ex-Dividend Date | Type | Payout Amount | Change | ||||||
|---|---|---|---|---|---|---|---|---|---|
| Loading, please wait... | |||||||||
Continue Researching SMMF
Want to see what other sources are saying about Summit Financial Group Inc's financials and stock price? Try the links below:Summit Financial Group Inc (SMMF) Stock Price | Nasdaq
Summit Financial Group Inc (SMMF) Stock Quote, History and News - Yahoo Finance
Summit Financial Group Inc (SMMF) Stock Price and Basic Information | MarketWatch
Loading social stream, please wait...