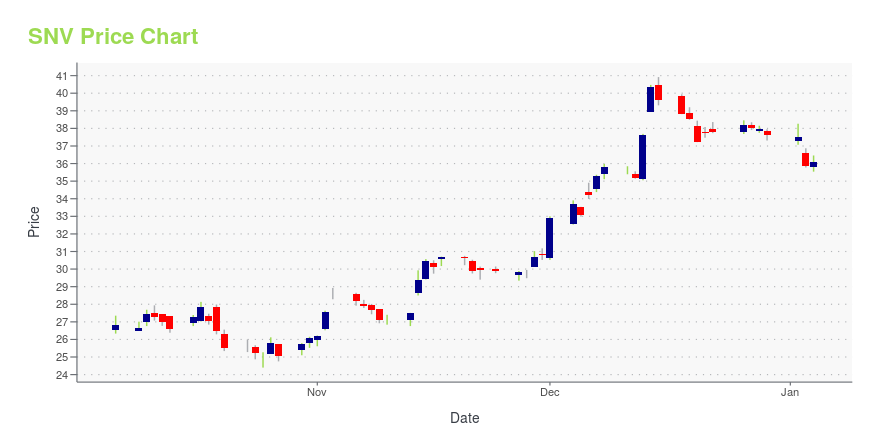
Synovus Financial Corp. (SNV): Price and Financial Metrics
SNV Price/Volume Stats
| Current price | $47.62 | 52-week high | $47.76 |
| Prev. close | $46.78 | 52-week low | $24.40 |
| Day low | $46.91 | Volume | 1,201,100 |
| Day high | $47.71 | Avg. volume | 1,435,211 |
| 50-day MA | $40.20 | Dividend yield | 3.27% |
| 200-day MA | $36.35 | Market Cap | 6.97B |
SNV Stock Price Chart Interactive Chart >
Synovus Financial Corp. (SNV) Company Bio
Synovus Financial operates as the bank holding company for Synovus Bank that provides various financial products and services. It offers integrated financial services, including commercial and retail banking, financial management, insurance, and mortgage services. The company has locations and ATM locations across Georgia, Alabama, South Carolina, Florida, and Tennessee. The company was founded in 1888 and is based in Columbus, Georgia.
Latest SNV News From Around the Web
Below are the latest news stories about SYNOVUS FINANCIAL CORP that investors may wish to consider to help them evaluate SNV as an investment opportunity.
Should Value Investors Buy Chemung Financial Corp (CHMG) Stock?Here at Zacks, our focus is on the proven Zacks Rank system, which emphasizes earnings estimates and estimate revisions to find great stocks. Nevertheless, we are always paying attention to the latest value, growth, and momentum trends to underscore strong picks. |
Synovus Financial Corp's Dividend AnalysisSynovus Financial Corp (NYSE:SNV) recently announced a dividend of $0.38 per share, payable on 2024-01-02, with the ex-dividend date set for 2023-12-20. As investors look forward to this upcoming payment, the spotlight also shines on the company's dividend history, yield, and growth rates. Using the data from GuruFocus, let's look into Synovus Financial Corp's dividend performance and assess its sustainability. |
Synovus to announce fourth quarter 2023 earnings resultsCOLUMBUS, Ga., December 18, 2023--Synovus Financial Corp. (NYSE: SNV) will announce fourth quarter 2023 earnings results after the market closes on Wednesday, Jan. 17, 2024, and host a conference call at 8:30 a.m. ET on Thursday, Jan. 18. |
Synovus (SNV) Surges 7.3%: Is This an Indication of Further Gains?Synovus (SNV) was a big mover last session on higher-than-average trading volume. The latest trend in earnings estimate revisions might help the stock continue moving higher in the near term. |
With 83% institutional ownership, Synovus Financial Corp. (NYSE:SNV) is a favorite amongst the big gunsKey Insights Institutions' substantial holdings in Synovus Financial implies that they have significant influence over... |
SNV Price Returns
| 1-mo | 26.25% |
| 3-mo | 30.56% |
| 6-mo | 25.28% |
| 1-year | 50.79% |
| 3-year | 31.72% |
| 5-year | 53.12% |
| YTD | 29.08% |
| 2023 | 5.14% |
| 2022 | -18.87% |
| 2021 | 52.31% |
| 2020 | -12.44% |
| 2019 | 26.60% |
SNV Dividends
| Ex-Dividend Date | Type | Payout Amount | Change | ||||||
|---|---|---|---|---|---|---|---|---|---|
| Loading, please wait... | |||||||||
Continue Researching SNV
Here are a few links from around the web to help you further your research on Synovus Financial Corp's stock as an investment opportunity:Synovus Financial Corp (SNV) Stock Price | Nasdaq
Synovus Financial Corp (SNV) Stock Quote, History and News - Yahoo Finance
Synovus Financial Corp (SNV) Stock Price and Basic Information | MarketWatch


Loading social stream, please wait...