
TD SYNNEX Corp. (SNX): Price and Financial Metrics
SNX Price/Volume Stats
| Current price | $118.25 | 52-week high | $133.85 |
| Prev. close | $116.12 | 52-week low | $89.73 |
| Day low | $117.57 | Volume | 611,200 |
| Day high | $119.30 | Avg. volume | 898,793 |
| 50-day MA | $122.66 | Dividend yield | 1.36% |
| 200-day MA | $109.05 | Market Cap | 10.11B |
SNX Stock Price Chart Interactive Chart >
TD SYNNEX Corp. (SNX) Company Bio
SYNNEX Corporation distributes a broad range of information technology systems and products, and also provides systems design and integration services. The Concentrix segment offers a portfolio of end-to-end outsourced services around process optimization, customer engagement strategy and back-office automation to clients in ten identified industry verticals. The company was founded in 1980 and is based in Fremont, California.
Latest SNX News From Around the Web
Below are the latest news stories about TD SYNNEX CORP that investors may wish to consider to help them evaluate SNX as an investment opportunity.
TD SYNNEX to Announce Fiscal 2023 Full Year and Fourth Quarter Results on January 9, 2024FREMONT, Calif. & CLEARWATER, Fla., December 19, 2023--TD SYNNEX (NYSE: SNX) today announced it will report its financial results for the fourth quarter and full year of fiscal 2023 before the U.S. market opens on Tuesday, January 9, 2024. A conference call to review the results will be held at 6:00 a.m. PT / 9:00 a.m. ET the same day. |
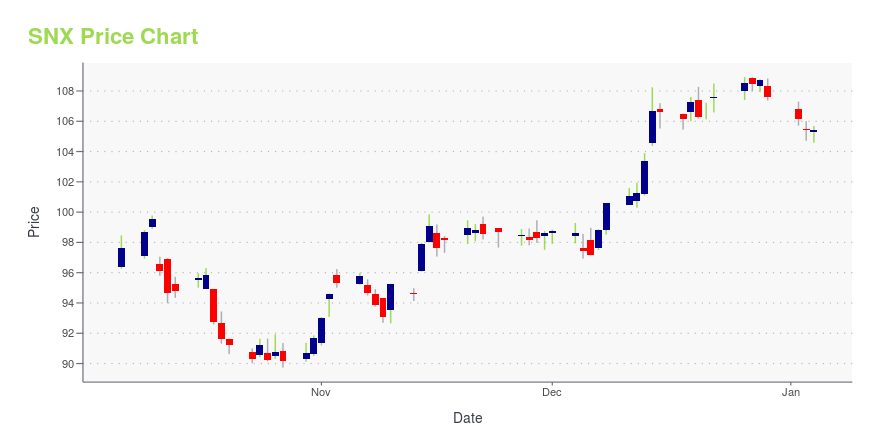
Wait for a Pullback to Buy Rallying TD SynnexTD Synnex Corp. is a distributor of information technology that was formed in 2021 by the merger of Synnex and Tech Data. Let's check on the trends and indicators of TD Synnex to see where the stock may go from here. In this daily bar chart of SNX, below, I can see that prices broke out over their September highs to complete a bottoming formation. |
TD SYNNEX (SNX) Unveils a Partner Program for Microsoft CopilotTD SYNNEX (SNX) launches the Enablement Journey program for Microsoft 365 Copilot to boost its generative AI offerings. |
TD SYNNEX Launches Global AI Enablement Journey for Microsoft 365 CopilotFREMONT, Calif., & CLEARWATER, Fla., December 11, 2023--TD SYNNEX launched its Enablement Journey for Microsoft 365 Copilot, a comprehensive program to prepare partners to navigate the AI-powered workplace. |
TD SYNNEX Earns Second-Consecutive Top Score in 2023-2024 Corporate Equality IndexFREMONT, Calif. & CLEARWATER, Fla., December 07, 2023--TD SYNNEX (NYSE: SNX) proudly announced that it received a score of 100 on the Human Rights Campaign Foundation’s 2023-2024 Corporate Equality Index. |
SNX Price Returns
| 1-mo | 2.71% |
| 3-mo | 1.05% |
| 6-mo | 17.28% |
| 1-year | 23.55% |
| 3-year | 4.20% |
| 5-year | 204.34% |
| YTD | 11.09% |
| 2023 | 15.25% |
| 2022 | -16.11% |
| 2021 | 41.48% |
| 2020 | 55.34% |
| 2019 | 61.74% |
SNX Dividends
| Ex-Dividend Date | Type | Payout Amount | Change | ||||||
|---|---|---|---|---|---|---|---|---|---|
| Loading, please wait... | |||||||||
Continue Researching SNX
Want to do more research on Synnex Corp's stock and its price? Try the links below:Synnex Corp (SNX) Stock Price | Nasdaq
Synnex Corp (SNX) Stock Quote, History and News - Yahoo Finance
Synnex Corp (SNX) Stock Price and Basic Information | MarketWatch
Loading social stream, please wait...