S&P Global Inc. (SPGI): Price and Financial Metrics


S&P Global Inc. (SPGI): $334.52

2.27 (+0.68%)

POWR Rating

Component Grades

Growth

S

Value

I

Momentum

G

Stability

N

Sentiment

U

Quality

P

SPGI POWR Grades

  • Sentiment is the dimension where SPGI ranks best; there it ranks ahead of 89.31% of US stocks.
  • The strongest trend for SPGI is in Sentiment, which has been heading up over the past 179 days.
  • SPGI's current lowest rank is in the Momentum metric (where it is better than 10.69% of US stocks).

SPGI Stock Summary

  • With a market capitalization of $109,377,576,000, S&P GLOBAL INC has a greater market value than 98.1% of US stocks.
  • S&P GLOBAL INC's stock had its IPO on January 1, 1986, making it an older stock than 93.52% of US equities in our set.
  • Of note is the ratio of S&P GLOBAL INC's sales and general administrative expense to its total operating expenses; 99.52% of US stocks have a lower such ratio.
  • If you're looking for stocks that are quantitatively similar to S&P GLOBAL INC, a group of peers worth examining would be GIS, BUD, HON, FISV, and BLK.
  • Visit SPGI's SEC page to see the company's official filings. To visit the company's web site, go to www.spglobal.com.

SPGI Valuation Summary

  • In comparison to the median Financial Services stock, SPGI's EV/EBIT ratio is 131.19% higher, now standing at 25.2.
  • Over the past 243 months, SPGI's EV/EBIT ratio has gone up 12.8.

Below are key valuation metrics over time for SPGI.

Stock Date P/S P/B P/E EV/EBIT
SPGI 2023-03-17 9.7 3.0 33.6 25.2
SPGI 2023-03-16 9.9 3.0 34.1 25.6
SPGI 2023-03-15 9.7 3.0 33.5 25.2
SPGI 2023-03-14 9.7 3.0 33.4 25.1
SPGI 2023-03-13 9.5 2.9 32.6 24.5
SPGI 2023-03-10 9.5 2.9 32.8 24.6

SPGI Growth Metrics

    The year over year net income to common stockholders growth rate now stands at 42.71%.
  • Its 2 year revenue growth rate is now at 25.4%.
  • Its year over year cash and equivalents growth rate is now at -2.46%.
Over the past 34 months, SPGI's revenue has gone up $4,267,000,000.

The table below shows SPGI's growth in key financial areas (numbers in millions of US dollars).

Date Revenue Operating Cash Flow Net Income to Common Stock
2022-12-31 11,181 2,603 3,248
2022-09-30 10,331 2,430 3,490
2022-06-30 9,557 2,583 3,679
2022-03-31 8,670 3,052 3,505
2021-12-31 8,297 3,598 3,024
2021-09-30 8,076 3,799 2,804

SPGI's Quality Factors

The “Quality” component of the POWR Ratings focuses on 31 different factors of a companies fundamentals and operational strength. Here are some key insights as we drill into the specifics of these quality attributes.
  • SPGI has a Quality Grade of A, ranking ahead of 99.6% of graded US stocks.
  • SPGI's asset turnover comes in at 0.611 -- ranking 265th of 563 Business Services stocks.
  • SNAP, GECC, and LPSN are the stocks whose asset turnover ratios are most correlated with SPGI.

The table below shows SPGI's key quality metrics over time.

Period Asset Turnover Gross Margin ROIC
2021-09-30 0.611 0.732 0.858
2021-06-30 0.624 0.727 0.740
2021-03-31 0.640 0.727 0.715
2020-12-31 0.653 0.719 0.662
2020-09-30 0.659 0.727 0.676
2020-06-30 0.664 0.732 0.753

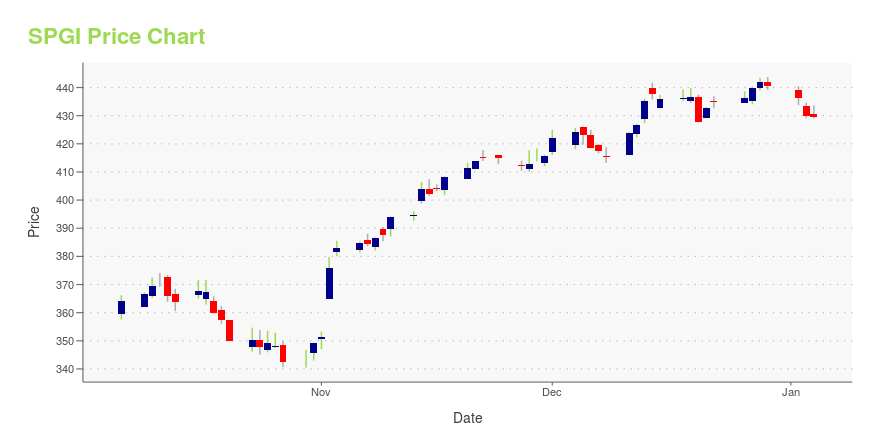
SPGI Stock Price Chart Interactive Chart >

Price chart for SPGI

SPGI Price/Volume Stats

Current price $334.52 52-week high $423.55
Prev. close $332.25 52-week low $279.32
Day low $327.08 Volume 1,192,800
Day high $335.33 Avg. volume 1,445,674
50-day MA $353.93 Dividend yield 1.08%
200-day MA $345.30 Market Cap 107.72B

S&P Global Inc. (SPGI) Company Bio


S&P Global provides the global capital and commodity markets with independent benchmarks, credit ratings, portfolio and enterprise risk solutions, and analytics. The company was founded in 1888 and is based in New York, New York.


SPGI Latest News Stream


Event/Time News Detail
Loading, please wait...

SPGI Latest Social Stream


Loading social stream, please wait...

View Full SPGI Social Stream

Latest SPGI News From Around the Web

Below are the latest news stories about S&P GLOBAL INC that investors may wish to consider to help them evaluate SPGI as an investment opportunity.

Weekly Roundup

That quick roller coaster ride for the S&P 500 hit the portfolio with some wide swings this week -- and big gains in Coty and ChargePoint as well as some slips in other stocks.

Yahoo | March 24, 2023

7 Ways Investors Cash In On Powell's Crazy Rate Hikes

Soaring interest rates have pounded most S&P 500 stocks. But a handful are thriving anyway — despite efforts by Fed chief Jay Powell.

Yahoo | March 24, 2023

US STOCKS-Wall St falls as bank contagion fears flare up

Wall Street's main indexes fell on Friday as investors fled from risky assets on growing concerns that a contagion in the banking sector had not been fully averted despite assurances from key officials. Treasury Secretary Janet Yellen said late on Thursday afternoon that measures will be taken to keep Americans' deposits safe, but that did little to ease investor nerves about a liquidity crisis in the banking sector that could limit lending and tip the economy into a severe recession. Yellen's comments had helped stem a late-night slide in stocks in the previous session, as she softened her stance from Wednesday when she had unnerved investors by saying that blanket insurance of all deposits was not being considered.

Yahoo | March 24, 2023

Gold miners help lift Toronto market to weekly gain

(Reuters) -Canada's main stock index recouped its earlier decline to close higher on Friday, helped by gains for industrial and gold mining shares, as hopes rose that the U.S. Federal Reserve's tightening campaign is coming to an end amid turmoil in the banking sector. The Toronto Stock Exchange's S&P/TSX composite index ended up 41.57 points, or 0.2%, at 19,501.49. Wall Street also closed higher as Fed officials calmed investor skittishness over a potential liquidity crisis in the banking sector.

Yahoo | March 24, 2023

Contradictory Yellen, Bank Stocks, Markets, Fed Balance Sheet, Awful Inflation

Late in the afternoon, after there had been some persistent price erosion evident for hours, the major indexes went red. The quote was ridiculous, out of sync with what the Fed Chair and the Secretary of the Treasury herself had previously messaged and markets sold off hard that afternoon.

Yahoo | March 24, 2023

Read More 'SPGI' Stories Here

SPGI Price Returns

1-mo -2.58%
3-mo 1.23%
6-mo 6.80%
1-year -18.31%
3-year 43.12%
5-year 86.91%
YTD 0.13%
2022 -28.38%
2021 44.68%
2020 21.40%
2019 62.27%
2018 1.37%

SPGI Dividends

Ex-Dividend Date Type Payout Amount Change
Loading, please wait...
View Full SPGI Dividend History

Continue Researching SPGI

Want to see what other sources are saying about S&P Global Inc's financials and stock price? Try the links below:

S&P Global Inc (SPGI) Stock Price | Nasdaq
S&P Global Inc (SPGI) Stock Quote, History and News - Yahoo Finance
S&P Global Inc (SPGI) Stock Price and Basic Information | MarketWatch

Get Free Updates

Join thousands of investors who get the latest news, insights and top rated picks from StockNews.com!


Page generated in 0.811 seconds.