SPS Commerce, Inc. (SPSC): Price and Financial Metrics
SPSC Price/Volume Stats
Current price | $184.90 | 52-week high | $218.74 |
Prev. close | $183.89 | 52-week low | $140.00 |
Day low | $182.73 | Volume | 297,900 |
Day high | $186.58 | Avg. volume | 169,430 |
50-day MA | $185.68 | Dividend yield | N/A |
200-day MA | $179.10 | Market Cap | 6.84B |
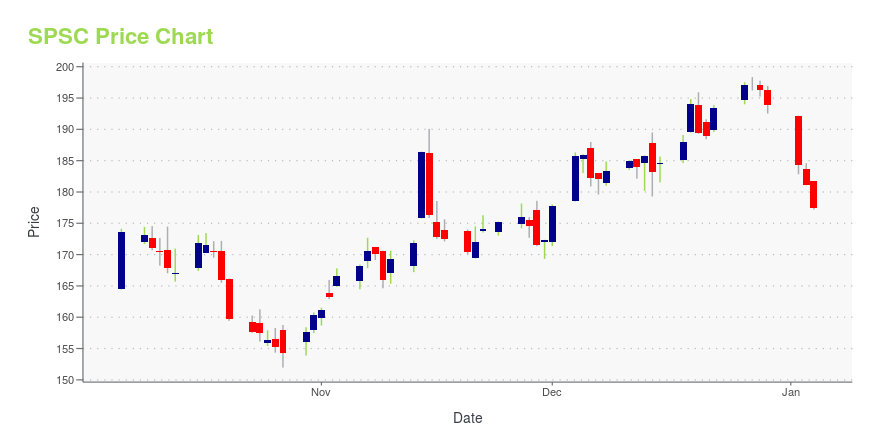
SPSC Stock Price Chart Interactive Chart >
SPSC POWR Grades
- SPSC scores best on the Sentiment dimension, with a Sentiment rank ahead of 85.31% of US stocks.
- SPSC's strongest trending metric is Quality; it's been moving down over the last 26 weeks.
- SPSC's current lowest rank is in the Value metric (where it is better than 10.34% of US stocks).
SPSC Stock Summary
- SPSC's one year PEG ratio, measuring expected growth in earnings next year relative to current common stock price is 491.71 -- higher than 93.38% of US-listed equities with positive expected earnings growth.
- SPSC's current price/earnings ratio is 105.93, which is higher than 94.18% of US stocks with positive earnings.
- Price to trailing twelve month operating cash flow for SPSC is currently 53.98, higher than 93.9% of US stocks with positive operating cash flow.
- Stocks with similar financial metrics, market capitalization, and price volatility to SPS COMMERCE INC are GDRX, STAA, NABL, CRSR, and PODD.
- Visit SPSC's SEC page to see the company's official filings. To visit the company's web site, go to www.spscommerce.com.
SPSC Valuation Summary
- SPSC's price/sales ratio is 13.1; this is 385.19% higher than that of the median Technology stock.
- SPSC's EV/EBIT ratio has moved down 13.3 over the prior 166 months.
Below are key valuation metrics over time for SPSC.
Stock | Date | P/S | P/B | P/E | EV/EBIT |
---|---|---|---|---|---|
SPSC | 2023-12-08 | 13.1 | 10.7 | 107.3 | 82.1 |
SPSC | 2023-12-07 | 13.0 | 10.7 | 106.6 | 81.5 |
SPSC | 2023-12-06 | 13.0 | 10.7 | 106.6 | 81.5 |
SPSC | 2023-12-05 | 13.3 | 10.9 | 108.7 | 83.2 |
SPSC | 2023-12-04 | 13.3 | 10.9 | 108.7 | 83.2 |
SPSC | 2023-12-01 | 12.7 | 10.4 | 104.0 | 79.5 |
SPSC Growth Metrics
- The 5 year price growth rate now stands at 100.9%.
- Its 3 year revenue growth rate is now at 56.35%.
- Its 2 year net income to common stockholders growth rate is now at 29.07%.
The table below shows SPSC's growth in key financial areas (numbers in millions of US dollars).
Date | Revenue | Operating Cash Flow | Net Income to Common Stock |
---|---|---|---|
2022-12-31 | 450.875 | 100.052 | 55.134 |
2022-09-30 | 431.613 | 107.808 | 51.984 |
2022-06-30 | 415.014 | 95.02 | 47.57 |
2022-03-31 | 400.375 | 95.635 | 47 |
2021-12-31 | 385.276 | 112.893 | 44.597 |
2021-09-30 | 365.828 | 104.601 | 45.302 |
SPSC's Quality Factors
The “Quality” component of the POWR Ratings focuses on 31 different factors of a companies fundamentals and operational strength. Here are some key insights as we drill into the specifics of these quality attributes.- SPSC has a Quality Grade of B, ranking ahead of 81.11% of graded US stocks.
- SPSC's asset turnover comes in at 0.653 -- ranking 248th of 563 Business Services stocks.
- WLDN, ADS, and VSEC are the stocks whose asset turnover ratios are most correlated with SPSC.
The table below shows SPSC's key quality metrics over time.
Period | Asset Turnover | Gross Margin | ROIC |
---|---|---|---|
2021-09-30 | 0.653 | 0.664 | 0.415 |
2021-06-30 | 0.651 | 0.673 | 0.427 |
2021-03-31 | 0.649 | 0.677 | 0.408 |
2020-12-31 | 0.653 | 0.681 | 0.401 |
2020-09-30 | 0.658 | 0.679 | 0.377 |
2020-06-30 | 0.661 | 0.676 | 0.355 |
SPSC Price Target
For more insight on analysts targets of SPSC, see our SPSC price target page. And for a list of of all stocks sorted by upside potential based on analyst target price, see our Top Price Target page.
Average Price Target | $138.57 | Average Broker Recommendation | 1.5 (Moderate Buy) |
SPS Commerce, Inc. (SPSC) Company Bio
SPS Commerce provides cloud-based supply chain management solutions worldwide. It provides solutions through the SPS Commerce platform, a cloud-based product suite that improves the way suppliers, retailers, distributors, and other customers manage and fulfill orders. The company was founded in 1987 and is based in Minneapolis, Minnesota.
Latest SPSC News From Around the Web
Below are the latest news stories about SPS COMMERCE INC that investors may wish to consider to help them evaluate SPSC as an investment opportunity.
Director Marty Reaume Sells 3,285 Shares of SPS Commerce Inc (SPSC)Director Marty Reaume has sold 3,285 shares of SPS Commerce Inc (NASDAQ:SPSC) on December 19, 2023, according to a recent SEC filing. |
3 Reasons Growth Investors Will Love SPS Commerce (SPSC)SPS Commerce (SPSC) is well positioned to outperform the market, as it exhibits above-average growth in financials. |
SPS Stock Etches Classic Double-Bottom Pattern; Set To Launch?After a series of jumps for a year to nearly double its stock price as of July, SPS Commerce has formed a fresh base. The 81 RS Rating means that SPS stock is among the top 19% of stocks, no matter what industry group, for price appreciation over the past 52 weeks. SPS just met that criteria. |
3 Reasons Why Growth Investors Shouldn't Overlook SPS Commerce (SPSC)SPS Commerce (SPSC) could produce exceptional returns because of its solid growth attributes. |
3 Tech Stocks Worth Grabbing Now to Generate Long-Term GainsAs the market enters rally territory, investors should add these tech stocks to their portfolios for solid long-term gains. |
SPSC Price Returns
1-mo | 0.35% |
3-mo | -4.61% |
6-mo | 8.38% |
1-year | 26.15% |
3-year | 92.16% |
5-year | 248.67% |
YTD | -4.61% |
2023 | 50.93% |
2022 | -9.78% |
2021 | 31.09% |
2020 | 95.94% |
2019 | 34.55% |
Continue Researching SPSC
Here are a few links from around the web to help you further your research on Sps Commerce Inc's stock as an investment opportunity:Sps Commerce Inc (SPSC) Stock Price | Nasdaq
Sps Commerce Inc (SPSC) Stock Quote, History and News - Yahoo Finance
Sps Commerce Inc (SPSC) Stock Price and Basic Information | MarketWatch
Loading social stream, please wait...