
SpartanNash Company (SPTN): Price and Financial Metrics
SPTN Price/Volume Stats
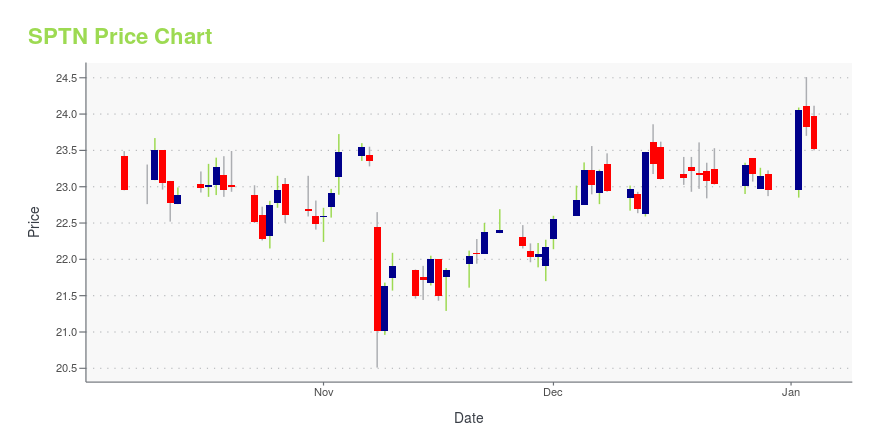
| Current price | $20.79 | 52-week high | $24.51 |
| Prev. close | $20.69 | 52-week low | $17.74 |
| Day low | $20.62 | Volume | 155,789 |
| Day high | $20.92 | Avg. volume | 257,505 |
| 50-day MA | $19.42 | Dividend yield | 4.25% |
| 200-day MA | $21.01 | Market Cap | 704.61M |
SPTN Stock Price Chart Interactive Chart >
SpartanNash Company (SPTN) Company Bio
SpartanNash Company operates as a grocery distributor and retailer primarily in the United States. The company operates in three segments: Military, Food Distribution, and Retail. The company was founded in 1917 and is based in Grand Rapids, Michigan.
Latest SPTN News From Around the Web
Below are the latest news stories about SPARTANNASH CO that investors may wish to consider to help them evaluate SPTN as an investment opportunity.
Is There An Opportunity With SpartanNash Company's (NASDAQ:SPTN) 50% Undervaluation?Key Insights The projected fair value for SpartanNash is US$46.04 based on 2 Stage Free Cash Flow to Equity Current... |
SpartanNash Announces 2023 Winners for Our Family® Scholarship ProgramFood solutions company SpartanNash (the "Company") (Nasdaq: SPTN) today announced the 2023 winners for its inaugural Our Family® 2023 Scholarship Program, supporting students making a positive difference in their communities. Developed in 1904, Our Family is the flagship private brand distributed exclusively by SpartanNash. Through this program, the Company is extending the opportunity for grocery shoppers at independent retailers and Company-operated stores to apply for academic scholarships fo |
SpartanNash Unveils Immersive Grocery Experience for High School Students in Partnership with Junior AchievementFood solutions company SpartanNash (the "Company") (Nasdaq: SPTN) today announced a partnership with youth education nonprofit Junior Achievement of the Michigan Great Lakes (JAMGL) to support JA Finance Park®, the organization's capstone program for financial planning and career exploration. On Monday, SpartanNash participated in a ribbon-cutting event outside of its new Family Fare experiential learning center. |
SpartanNash Company (NASDAQ:SPTN) Looks Like A Good Stock, And It's Going Ex-Dividend SoonRegular readers will know that we love our dividends at Simply Wall St, which is why it's exciting to see SpartanNash... |
SpartanNash names new chief customer officerAmy McClellan will take over for David Sisk, who is departing the company at the end of the year. |
SPTN Price Returns
| 1-mo | 12.08% |
| 3-mo | 8.92% |
| 6-mo | -6.74% |
| 1-year | -3.32% |
| 3-year | 20.75% |
| 5-year | 117.64% |
| YTD | -7.35% |
| 2023 | -21.15% |
| 2022 | 20.65% |
| 2021 | 53.47% |
| 2020 | 28.06% |
| 2019 | -12.26% |
SPTN Dividends
| Ex-Dividend Date | Type | Payout Amount | Change | ||||||
|---|---|---|---|---|---|---|---|---|---|
| Loading, please wait... | |||||||||
Continue Researching SPTN
Here are a few links from around the web to help you further your research on SpartanNash Co's stock as an investment opportunity:SpartanNash Co (SPTN) Stock Price | Nasdaq
SpartanNash Co (SPTN) Stock Quote, History and News - Yahoo Finance
SpartanNash Co (SPTN) Stock Price and Basic Information | MarketWatch
Loading social stream, please wait...