Sociedad Quimica y Minera S.A. (SQM): Price and Financial Metrics
SQM Price/Volume Stats
Current price | $60.00 | 52-week high | $112.35 |
Prev. close | $58.24 | 52-week low | $54.28 |
Day low | $60.00 | Volume | 14,167 |
Day high | $60.00 | Avg. volume | 1,610,748 |
50-day MA | $64.61 | Dividend yield | 3.56% |
200-day MA | $75.40 | Market Cap | 17.14B |
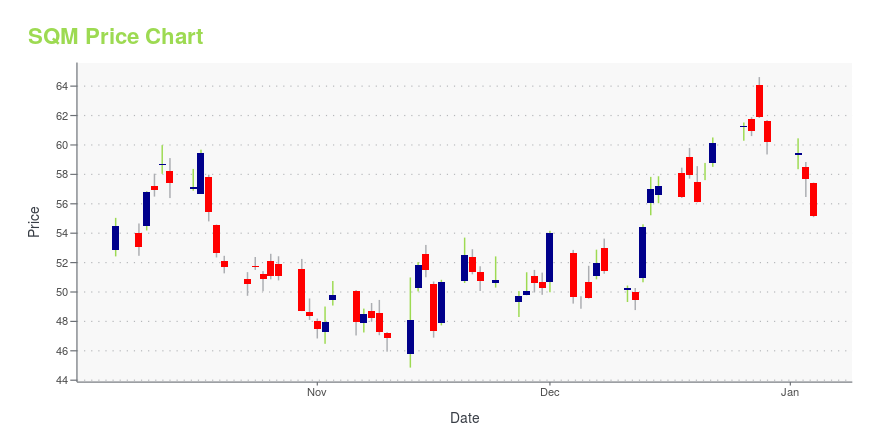
SQM Stock Price Chart Interactive Chart >
SQM POWR Grades
- Quality is the dimension where SQM ranks best; there it ranks ahead of 91.53% of US stocks.
- The strongest trend for SQM is in Growth, which has been heading down over the past 177 days.
- SQM's current lowest rank is in the Sentiment metric (where it is better than 5.35% of US stocks).
SQM Stock Summary
- Of note is the ratio of CHEMICAL & MINING CO OF CHILE INC's sales and general administrative expense to its total operating expenses; 98.25% of US stocks have a lower such ratio.
- Over the past twelve months, SQM has reported earnings growth of 719.95%, putting it ahead of 97.7% of US stocks in our set.
- Revenue growth over the past 12 months for CHEMICAL & MINING CO OF CHILE INC comes in at 372.71%, a number that bests 98.09% of the US stocks we're tracking.
- Stocks that are quantitatively similar to SQM, based on their financial statements, market capitalization, and price volatility, are WLKP, RAND, CLF, NOVA, and GGB.
- Visit SQM's SEC page to see the company's official filings. To visit the company's web site, go to www.sqm.com.
SQM Valuation Summary
- In comparison to the median Basic Materials stock, SQM's price/sales ratio is 30.77% higher, now standing at 1.7.
- Over the past 243 months, SQM's price/earnings ratio has gone down 20.6.
Below are key valuation metrics over time for SQM.
Stock | Date | P/S | P/B | P/E | EV/EBIT |
---|---|---|---|---|---|
SQM | 2023-09-06 | 1.7 | 3.6 | 4.5 | 3.2 |
SQM | 2023-09-05 | 1.7 | 3.7 | 4.6 | 3.3 |
SQM | 2023-09-01 | 1.7 | 3.7 | 4.6 | 3.3 |
SQM | 2023-08-31 | 1.7 | 3.7 | 4.6 | 3.3 |
SQM | 2023-08-30 | 1.7 | 3.6 | 4.6 | 3.3 |
SQM | 2023-08-29 | 1.7 | 3.7 | 4.6 | 3.3 |
SQM Growth Metrics
- The 2 year cash and equivalents growth rate now stands at -8.45%.
- Its 5 year net cashflow from operations growth rate is now at -63.49%.
- The 2 year revenue growth rate now stands at -19.8%.

The table below shows SQM's growth in key financial areas (numbers in millions of US dollars).
Date | Revenue | Operating Cash Flow | Net Income to Common Stock |
---|---|---|---|
2021-12-31 | 2,862.315 | 975.634 | 585.454 |
2020-12-31 | 1,817.191 | 347.067 | 164.518 |
2019-12-31 | 1,943.655 | 541.791 | 278.115 |
2018-12-31 | 2,265.803 | 833.733 | 439.83 |
2017-12-31 | 2,157.323 | 950.707 | 427.697 |
SQM's Quality Factors
The “Quality” component of the POWR Ratings focuses on 31 different factors of a companies fundamentals and operational strength. Here are some key insights as we drill into the specifics of these quality attributes.- SQM has a Quality Grade of C, ranking ahead of 69.67% of graded US stocks.
- SQM's asset turnover comes in at 0.382 -- ranking 19th of 42 Non-Metallic and Industrial Metal Mining stocks.
- 500 - Internal server error
The table below shows SQM's key quality metrics over time.
Period | Asset Turnover | Gross Margin | ROIC |
---|---|---|---|
2020-12-31 | 0.382 | 0.266 | 0.060 |
2019-12-31 | 0.434 | 0.288 | 0.101 |
2018-12-31 | 0.529 | 0.345 | 0.163 |
2017-12-31 | 0.507 | 0.353 | 0.156 |
2016-12-31 | 0.438 | 0.315 | 0.102 |
2015-12-31 | 0.371 | 0.314 | 0.072 |
Sociedad Quimica y Minera S.A. (SQM) Company Bio
Chemical & Mining Company of Chile is an integrated producer and distributor of specialty plant nutrients, iodine, lithium, potassium-related fertilizers and industrial chemicals. The company was founded in 1968 and is based in Santiago, Chile.
Latest SQM News From Around the Web
Below are the latest news stories about CHEMICAL & MINING CO OF CHILE INC that investors may wish to consider to help them evaluate SQM as an investment opportunity.
Betting Big: 3 Lithium Stocks Primed for a BreakoutWhile the sector is currently stuck in a downtrend, these lithium stocks to buy now are poised for big recoveries when sentiment improves. |
The 3 Most Undervalued Emerging Markets Stocks to Buy in September 2023Emerging market stocks are certainly worth looking into for any investor that wants to diversify their portfolio. |
The 3 Most Undervalued Lithium Stocks to Buy in September 2023As the commodity cycle gets underway, a special pocket of interest is headed to lithium, making these undervalued lithium stocks a good deal. |
‘The Balance Is to the Upside’: Citi Recommends Owning These 3 Stocks for 40%-Plus Upside — Here’s Why They Could SurgeWith the third quarter winding down, and the final quarter of the year almost upon us, it’s time to take stock of stock markets. Where are we likely to go in the next few months, and what are the likely forces to impact trading? In some recent comments on CNBC, Citi strategist Scott Chronert lays out his own belief that we’re likely to see some further gains. Chronert first points out that fears of a hard recession have faded, or as he puts it, “We’ve been pricing in a soft landing since the fir |
2 Undervalued Lithium Mining Stocks to ConsiderAlthough risky, these companiess present compelling features amid secular industry growth |
SQM Price Returns
1-mo | -3.80% |
3-mo | -16.86% |
6-mo | -23.32% |
1-year | -30.12% |
3-year | 116.81% |
5-year | 55.33% |
YTD | -22.15% |
2022 | 67.65% |
2021 | 5.36% |
2020 | 87.33% |
2019 | -28.34% |
2018 | -33.59% |
SQM Dividends
Ex-Dividend Date | Type | Payout Amount | Change | ||||||
---|---|---|---|---|---|---|---|---|---|
Loading, please wait... |
Continue Researching SQM
Want to see what other sources are saying about Chemical & Mining Co Of Chile Inc's financials and stock price? Try the links below:Chemical & Mining Co Of Chile Inc (SQM) Stock Price | Nasdaq
Chemical & Mining Co Of Chile Inc (SQM) Stock Quote, History and News - Yahoo Finance
Chemical & Mining Co Of Chile Inc (SQM) Stock Price and Basic Information | MarketWatch
Loading social stream, please wait...