1st Source Corporation (SRCE): Price and Financial Metrics
SRCE Price/Volume Stats
Current price | $41.95 | 52-week high | $59.94 |
Prev. close | $41.57 | 52-week low | $38.77 |
Day low | $41.54 | Volume | 7,063 |
Day high | $42.14 | Avg. volume | 56,726 |
50-day MA | $45.14 | Dividend yield | 3.05% |
200-day MA | $46.25 | Market Cap | 1.04B |
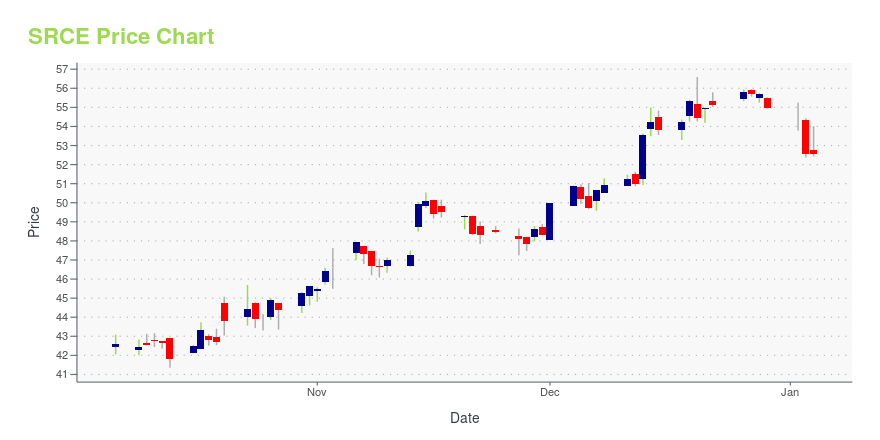
SRCE Stock Price Chart Interactive Chart >
SRCE POWR Grades
- SRCE scores best on the Sentiment dimension, with a Sentiment rank ahead of 92.33% of US stocks.
- The strongest trend for SRCE is in Growth, which has been heading down over the past 179 days.
- SRCE ranks lowest in Value; there it ranks in the 26th percentile.
SRCE Stock Summary
- SRCE's current price/earnings ratio is 8.22, which is higher than only 22.21% of US stocks with positive earnings.
- SRCE's equity multiplier -- a measure of assets relative to shareholders'equity -- is greater than that of 88.39% of US stocks.
- The volatility of 1ST SOURCE CORP's share price is greater than that of only 23.44% US stocks with at least 200 days of trading history.
- Stocks that are quantitatively similar to SRCE, based on their financial statements, market capitalization, and price volatility, are HTLF, UCBI, CBFV, SMBK, and RNST.
- SRCE's SEC filings can be seen here. And to visit 1ST SOURCE CORP's official web site, go to www.1stsource.com.
SRCE Valuation Summary
- SRCE's EV/EBIT ratio is 7.5; this is 33.63% lower than that of the median Financial Services stock.
- SRCE's price/sales ratio has moved up 0.3 over the prior 243 months.
Below are key valuation metrics over time for SRCE.
Stock | Date | P/S | P/B | P/E | EV/EBIT |
---|---|---|---|---|---|
SRCE | 2023-09-15 | 3.0 | 1.2 | 8.4 | 7.5 |
SRCE | 2023-09-14 | 3.0 | 1.2 | 8.5 | 7.6 |
SRCE | 2023-09-13 | 3.0 | 1.2 | 8.4 | 7.5 |
SRCE | 2023-09-12 | 3.0 | 1.2 | 8.5 | 7.6 |
SRCE | 2023-09-11 | 3.0 | 1.2 | 8.5 | 7.6 |
SRCE | 2023-09-08 | 3.1 | 1.2 | 8.6 | 7.7 |
SRCE Growth Metrics
- Its 2 year price growth rate is now at 48.34%.
- Its 5 year net cashflow from operations growth rate is now at 55.41%.
- Its 3 year cash and equivalents growth rate is now at 515.97%.

The table below shows SRCE's growth in key financial areas (numbers in millions of US dollars).
Date | Revenue | Operating Cash Flow | Net Income to Common Stock |
---|---|---|---|
2022-12-31 | 341.486 | 175.53 | 120.509 |
2022-09-30 | 337.105 | 193.43 | 117.164 |
2022-06-30 | 339.611 | 157.158 | 116.91 |
2022-03-31 | 340.68 | 166.075 | 117.819 |
2021-12-31 | 341.033 | 166.761 | 118.534 |
2021-09-30 | 339.143 | 162.555 | 117.275 |
SRCE's Quality Factors
The “Quality” component of the POWR Ratings focuses on 31 different factors of a companies fundamentals and operational strength. Here are some key insights as we drill into the specifics of these quality attributes.- SRCE has a Quality Grade of C, ranking ahead of 48.26% of graded US stocks.
- SRCE's asset turnover comes in at 0.044 -- ranking 116th of 430 Banking stocks.
- CVLY, FMBI, and TCBI are the stocks whose asset turnover ratios are most correlated with SRCE.
The table below shows SRCE's key quality metrics over time.
Period | Asset Turnover | Gross Margin | ROIC |
---|---|---|---|
2021-09-30 | 0.044 | 1 | 0.021 |
2021-06-30 | 0.043 | 1 | 0.019 |
2021-03-31 | 0.042 | 1 | 0.016 |
2020-12-31 | 0.041 | 1 | 0.015 |
2020-09-30 | 0.041 | 1 | 0.014 |
2020-06-30 | 0.043 | 1 | 0.015 |
SRCE Price Target
For more insight on analysts targets of SRCE, see our SRCE price target page. And for a list of of all stocks sorted by upside potential based on analyst target price, see our Top Price Target page.
Average Price Target | $48.33 | Average Broker Recommendation | 1.83 (Hold) |
1st Source Corporation (SRCE) Company Bio
1st Source Corporation provides commercial and consumer banking services, trust and investment management services, and insurance to individual and business clients in Indiana and Michigan. The company was founded in 1863 and is based in South Bend, Indiana.
Latest SRCE News From Around the Web
Below are the latest news stories about 1ST SOURCE CORP that investors may wish to consider to help them evaluate SRCE as an investment opportunity.
Why You Might Be Interested In 1st Source Corporation (NASDAQ:SRCE) For Its Upcoming DividendIt looks like 1st Source Corporation ( NASDAQ:SRCE ) is about to go ex-dividend in the next 4 days. Typically, the... |
1st Source's (NASDAQ:SRCE) Dividend Will Be $0.321st Source Corporation's ( NASDAQ:SRCE ) investors are due to receive a payment of $0.32 per share on 11th of August... |
1st Source says 450,000 records affected in client data breachA third party had gained access to data of its commercial and individual clients, 1st Source reported earlier this month, adding that it was in the process of identifying and notifying individual clients affected. Last month, the U.S. security researchers reported that hackers had stolen data from the systems of a number of users shortly after MOVEit's developer Progress Software Corp disclosed that a security flaw had been discovered. MOVEit, made by Massachusetts-based Progress, allows organizations to securely transfer files and data between business partners and customers. |
1st Source Corporation Reports Strong Second Quarter Results, Cash Dividend DeclaredQUARTERLY HIGHLIGHTSNet income was $32.44 million for the quarter, up $3.12 million or 10.65% from the second quarter of 2022. Diluted net income per common share was $1.30, up $0.12 or 10.17% from the prior year's second quarter of $1.18.Cash dividend of $0.32 per common share was approved, equal to the cash dividend declared a year ago.Average loans and leases grew $104.95 million in the second quarter, up 1.74% (6.96% annualized growth) from the ... |
Earnings Preview: Huntington Bancshares (HBAN) Q2 Earnings Expected to DeclineHuntington Bancshares (HBAN) doesn't possess the right combination of the two key ingredients for a likely earnings beat in its upcoming report. Get prepared with the key expectations. |
SRCE Price Returns
1-mo | -5.03% |
3-mo | -0.15% |
6-mo | -2.58% |
1-year | -9.95% |
3-year | 53.03% |
5-year | -8.49% |
YTD | -19.31% |
2022 | 9.81% |
2021 | 26.44% |
2020 | -19.85% |
2019 | 31.62% |
2018 | -16.90% |
SRCE Dividends
Ex-Dividend Date | Type | Payout Amount | Change | ||||||
---|---|---|---|---|---|---|---|---|---|
Loading, please wait... |
Continue Researching SRCE
Want to do more research on 1St Source Corp's stock and its price? Try the links below:1St Source Corp (SRCE) Stock Price | Nasdaq
1St Source Corp (SRCE) Stock Quote, History and News - Yahoo Finance
1St Source Corp (SRCE) Stock Price and Basic Information | MarketWatch
Loading social stream, please wait...