South State Corporation (SSB): Price and Financial Metrics
GET POWR RATINGS... FREE!
SSB POWR Grades
- Momentum is the dimension where SSB ranks best; there it ranks ahead of 81.87% of US stocks.
- The strongest trend for SSB is in Sentiment, which has been heading down over the past 177 days.
- SSB's current lowest rank is in the Sentiment metric (where it is better than 6.54% of US stocks).
SSB Stock Summary
- With a one year PEG ratio of 231.76, SOUTHSTATE CORP is expected to have a higher PEG ratio (a measure of how expensive a stock is relative to its expected earnings growth) than 87.76% of US stocks.
- Equity multiplier, or assets relative to shareholders' equity, comes in at 8.98 for SOUTHSTATE CORP; that's greater than it is for 88.29% of US stocks.
- In terms of volatility of its share price, SSB is more volatile than just 5.73% of stocks we're observing.
- Stocks with similar financial metrics, market capitalization, and price volatility to SOUTHSTATE CORP are WTFC, BUSE, TBBK, CHCO, and CATY.
- SSB's SEC filings can be seen here. And to visit SOUTHSTATE CORP's official web site, go to www.southstatebank.com.
SSB Valuation Summary
- In comparison to the median Financial Services stock, SSB's EV/EBIT ratio is 25.69% lower, now standing at 8.1.
- Over the past 243 months, SSB's price/sales ratio has gone up 0.3.
Below are key valuation metrics over time for SSB.
Stock | Date | P/S | P/B | P/E | EV/EBIT |
---|---|---|---|---|---|
SSB | 2023-03-17 | 3.5 | 1.1 | 11.1 | 8.1 |
SSB | 2023-03-16 | 3.7 | 1.1 | 11.6 | 8.5 |
SSB | 2023-03-15 | 3.6 | 1.1 | 11.3 | 8.3 |
SSB | 2023-03-14 | 3.7 | 1.1 | 11.6 | 8.5 |
SSB | 2023-03-13 | 3.4 | 1.0 | 10.6 | 7.7 |
SSB | 2023-03-10 | 3.7 | 1.1 | 11.6 | 8.5 |
SSB Growth Metrics
- Its 4 year net cashflow from operations growth rate is now at 39.41%.
- Its 5 year cash and equivalents growth rate is now at 90.44%.
- The 4 year cash and equivalents growth rate now stands at 90.44%.

The table below shows SSB's growth in key financial areas (numbers in millions of US dollars).
Date | Revenue | Operating Cash Flow | Net Income to Common Stock |
---|---|---|---|
2022-12-31 | 1,563.063 | 1,730.893 | 496.049 |
2022-09-30 | 1,509.964 | 693.452 | 459.393 |
2022-06-30 | 1,484.352 | 593.373 | 449.138 |
2022-03-31 | 1,492.01 | 410.419 | 428.923 |
2021-12-31 | 1,552.7 | 537.265 | 475.543 |
2021-09-30 | 1,538.778 | 608.851 | 454.933 |
SSB's Quality Factors
The “Quality” component of the POWR Ratings focuses on 31 different factors of a companies fundamentals and operational strength. Here are some key insights as we drill into the specifics of these quality attributes.- SSB has a Quality Grade of C, ranking ahead of 25.65% of graded US stocks.
- SSB's asset turnover comes in at 0.039 -- ranking 191st of 428 Banking stocks.
- PPBI, NWBI, and STBA are the stocks whose asset turnover ratios are most correlated with SSB.
The table below shows SSB's key quality metrics over time.
Period | Asset Turnover | Gross Margin | ROIC |
---|---|---|---|
2021-06-30 | 0.039 | 1 | 0.015 |
2021-03-31 | 0.031 | 1 | 0.008 |
2020-12-31 | 0.028 | 1 | 0.004 |
2020-09-30 | 0.026 | 1 | 0.004 |
2020-06-30 | 0.024 | 1 | 0.002 |
2020-03-31 | 0.039 | 1 | 0.013 |
SSB Price Target
For more insight on analysts targets of SSB, see our SSB price target page. And for a list of of all stocks sorted by upside potential based on analyst target price, see our Top Price Target page.
Average Price Target | $82.43 | Average Broker Recommendation | 1.81 (Hold) |
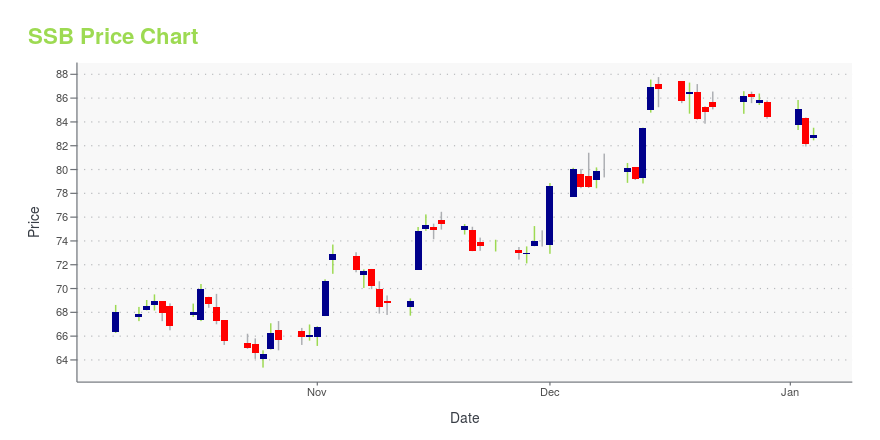
SSB Stock Price Chart Interactive Chart >
SSB Price/Volume Stats
Current price | $72.08 | 52-week high | $91.74 |
Prev. close | $73.02 | 52-week low | $66.56 |
Day low | $71.04 | Volume | 1,134,500 |
Day high | $73.94 | Avg. volume | 886,027 |
50-day MA | $77.75 | Dividend yield | 2.74% |
200-day MA | $80.59 | Market Cap | 5.47B |
South State Corporation (SSB) Company Bio
South State Corporation operates as the bank holding company for South State Bank that provides a range of retail and commercial banking services, mortgage lending services, trust and investment services, and consumer finance loans. The company has branches across South Carolina, North Carolina, and Georgia. The company was founded in 1933 and is based in Columbia, South Carolina.
Latest SSB News From Around the Web
Below are the latest news stories about SOUTHSTATE CORP that investors may wish to consider to help them evaluate SSB as an investment opportunity.
3.2% earnings growth over 5 years has not materialized into gains for SouthState (NASDAQ:SSB) shareholders over that periodIdeally, your overall portfolio should beat the market average. But the main game is to find enough winners to more... |
South State (SSB) Surges 9.2%: Is This an Indication of Further Gains?South State (SSB) witnessed a jump in share price last session on above-average trading volume. The latest trend in earnings estimate revisions for the stock suggests that there could be more strength down the road. |
Fair Isaac & Co. Set to Join S&P 500; Others to Join S&P MidCap 400 and S&P SmallCap 600S&P Dow Jones Indices ("S&P DJI") will make the following changes to the S&P 500, S&P MidCap 400 and S&P SmallCap 600 indices effective prior to the open of trading on Monday, March 20, to coincide with the quarterly rebalance. The changes are being made to ensure each index is more representative of its market capitalization range. The company moving to the S&P 500 is more representative of the large-cap market space. All companies moving to the S&P MidCap 400 are more representative of the mid |
SouthState Adds Bankers Dedicated to Helping Customers Grow Business, WealthSouthState Bank has hired five bankers who bring years of financial expertise and relationship building to the Commercial and Wealth teams in Georgia, Virginia and Alabama. |
SouthState Full Year 2022 Earnings: EPS Misses ExpectationsSouthState ( NASDAQ:SSB ) Full Year 2022 Results Key Financial Results Revenue: US$1.56b (flat on FY 2021). Net income... |
SSB Price Returns
1-mo | -10.66% |
3-mo | -5.02% |
6-mo | -7.82% |
1-year | -11.13% |
3-year | 30.09% |
5-year | -4.77% |
YTD | -5.02% |
2022 | -2.39% |
2021 | 13.51% |
2020 | -14.13% |
2019 | 47.99% |
2018 | -30.04% |
SSB Dividends
Ex-Dividend Date | Type | Payout Amount | Change | ||||||
---|---|---|---|---|---|---|---|---|---|
Loading, please wait... |
Continue Researching SSB
Here are a few links from around the web to help you further your research on SOUTH STATE Corp's stock as an investment opportunity:SOUTH STATE Corp (SSB) Stock Price | Nasdaq
SOUTH STATE Corp (SSB) Stock Quote, History and News - Yahoo Finance
SOUTH STATE Corp (SSB) Stock Price and Basic Information | MarketWatch
Loading social stream, please wait...