Shutterstock, Inc. (SSTK): Price and Financial Metrics
GET POWR RATINGS... FREE!
SSTK POWR Grades
- Sentiment is the dimension where SSTK ranks best; there it ranks ahead of 97.45% of US stocks.
- The strongest trend for SSTK is in Momentum, which has been heading down over the past 179 days.
- SSTK ranks lowest in Momentum; there it ranks in the 23rd percentile.
SSTK Stock Summary
- SSTK's one year PEG ratio, measuring expected growth in earnings next year relative to current common stock price is 227.4 -- higher than 89.01% of US-listed equities with positive expected earnings growth.
- SSTK's current price/earnings ratio is 38.64, which is higher than 79.65% of US stocks with positive earnings.
- The ratio of debt to operating expenses for Shutterstock Inc is higher than it is for about merely 13.91% of US stocks.
- Stocks that are quantitatively similar to SSTK, based on their financial statements, market capitalization, and price volatility, are WISH, BCPC, DGLY, XGN, and VCYT.
- SSTK's SEC filings can be seen here. And to visit Shutterstock Inc's official web site, go to www.shutterstock.com.
SSTK Valuation Summary
- SSTK's price/sales ratio is 5.8; this is 9.43% higher than that of the median Technology stock.
- SSTK's price/earnings ratio has moved up 5.3 over the prior 108 months.
Below are key valuation metrics over time for SSTK.
Stock | Date | P/S | P/B | P/E | EV/EBIT |
---|---|---|---|---|---|
SSTK | 2021-09-01 | 5.8 | 9.0 | 38.8 | 29.0 |
SSTK | 2021-08-31 | 5.9 | 9.1 | 39.3 | 29.4 |
SSTK | 2021-08-30 | 5.9 | 9.2 | 39.7 | 29.8 |
SSTK | 2021-08-27 | 6.0 | 9.2 | 39.9 | 30.0 |
SSTK | 2021-08-26 | 5.8 | 8.9 | 38.7 | 28.9 |
SSTK | 2021-08-25 | 5.8 | 8.9 | 38.7 | 29.0 |
SSTK Growth Metrics
- The 5 year net cashflow from operations growth rate now stands at 3.42%.
- Its 5 year revenue growth rate is now at 45.96%.
- Its year over year net cashflow from operations growth rate is now at 116.09%.

The table below shows SSTK's growth in key financial areas (numbers in millions of US dollars).
Date | Revenue | Operating Cash Flow | Net Income to Common Stock |
---|---|---|---|
2021-12-31 | 773.415 | 216.372 | 91.883 |
2021-09-30 | 748.576 | 226.705 | 100.876 |
2021-06-30 | 719.364 | 235.945 | 107.429 |
2021-03-31 | 688.682 | 194.041 | 96.962 |
2020-12-31 | 666.686 | 165.072 | 71.766 |
2020-09-30 | 652.113 | 125.851 | 50.24 |
SSTK's Quality Factors
The “Quality” component of the POWR Ratings focuses on 31 different factors of a companies fundamentals and operational strength. Here are some key insights as we drill into the specifics of these quality attributes.- SSTK has a Quality Grade of B, ranking ahead of 87.48% of graded US stocks.
- SSTK's asset turnover comes in at 0.959 -- ranking 138th of 563 Business Services stocks.
- NOW, DUOT, and MRIN are the stocks whose asset turnover ratios are most correlated with SSTK.
The table below shows SSTK's key quality metrics over time.
Period | Asset Turnover | Gross Margin | ROIC |
---|---|---|---|
2021-09-30 | 0.959 | 0.645 | -2.466 |
2021-06-30 | 0.969 | 0.644 | -4.248 |
2021-03-31 | 0.984 | 0.634 | -9.261 |
2020-12-31 | 1.003 | 0.611 | -97.467 |
2020-09-30 | 1.019 | 0.594 | 6.787 |
2020-06-30 | 1.038 | 0.577 | 2.524 |
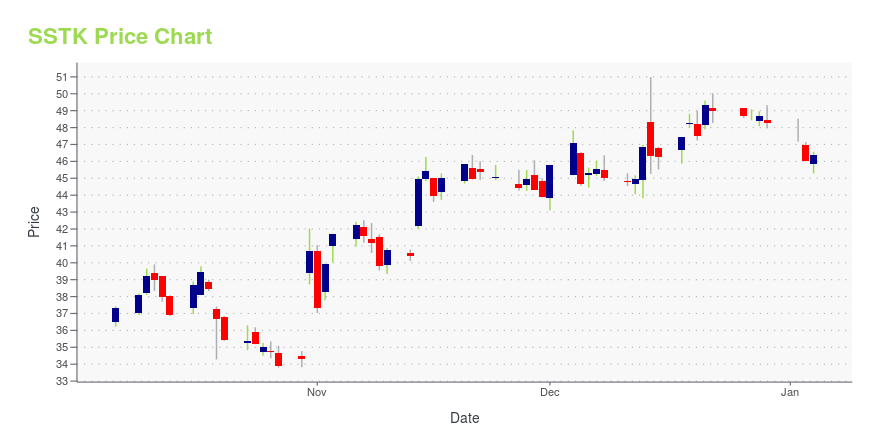
SSTK Stock Price Chart Interactive Chart >
SSTK Price/Volume Stats
Current price | $56.83 | 52-week high | $128.36 |
Prev. close | $57.31 | 52-week low | $51.68 |
Day low | $56.07 | Volume | 264,700 |
Day high | $58.38 | Avg. volume | 341,726 |
50-day MA | $62.00 | Dividend yield | 1.69% |
200-day MA | $93.47 | Market Cap | 2.06B |
Shutterstock, Inc. (SSTK) Company Bio
Shutterstock operates as an online marketplace for commercial digital content imagery. The company was founded in 2003 and is based in New York, New York.
Latest SSTK News From Around the Web
Below are the latest news stories about Shutterstock Inc that investors may wish to consider to help them evaluate SSTK as an investment opportunity.
Shutterstock, Inc. Updates 1 Key Risk FactorShares of global creative platform provider Shutterstock, Inc. (SSTK) have declined 15.8% so far this year. Recently, SSTK delivered a robust fourth-quarter performance marked by better-than-expected numbers on both its top-line and bottom-line fronts. Driven by enterprise sales and the popularity of subscription products, revenue increased 13.7% year-over-year to $205.8 million, beating estimates by $3.9 million. Earnings per share at $0.77 came in ahead of expectations by $0.29. Notably, the company’s number of subscribers jumped 22% to 343,000, and average revenue per customer increased 14% to $368 during this period. |
10 Best Mid Cap Stocks To Buy In 2022In this article, we discuss 10 best mid cap stocks to buy in 2022. If you want to skip our detailed analysis of these stocks, go directly to 5 Best Mid Cap Stocks To Buy In 2022. Mid cap stocks fall between small and large-cap companies, with market capitalization ranging from $2 billion to $10 […] |
Bernzott Capital: “Shutterstock (SSTK)’s Competitive Position is Strengthening”Bernzott Capital Advisors, an investment management firm, published its “US Small Cap Value Fund” fourth quarter 2021 investor letter – a copy of which can be downloaded here. The portfolio rose 4.2% (gross) slightly underperforming the Russell 2000 Value’s advance of 4.3%, and somewhat less than the Russell 2500 Value’s gain of 6.3%. Industrials, the […] |
Shutterstock (NYSE:SSTK) Is Increasing Its Dividend To US$0.24Shutterstock, Inc. ( NYSE:SSTK ) will increase its dividend on the 17th of March to US$0.24. Although the dividend is... |
Analysts Conflicted on These Technology Names: Shutterstock (SSTK) and Datadog (DDOG)Analysts have been eager to weigh in on the Technology sector with new ratings on Shutterstock (SSTK – Research Report) and Datadog (DDOG – Research Report). Shutterstock (SSTK) JMP Securities analyst Andrew Boone reiterated a Buy rating on Shutterstock today and set a price target of $125.00. The company's shares closed last Thursday at $86.25. According to TipRanks. |
SSTK Price Returns
1-mo | -4.57% |
3-mo | -37.74% |
6-mo | -45.49% |
1-year | -42.64% |
3-year | 53.41% |
5-year | 31.70% |
YTD | -48.40% |
2021 | 55.94% |
2020 | 69.71% |
2019 | 19.08% |
2018 | -16.31% |
2017 | -9.45% |
SSTK Dividends
Ex-Dividend Date | Type | Payout Amount | Change | ||||||
---|---|---|---|---|---|---|---|---|---|
Loading, please wait... |
Continue Researching SSTK
Want to see what other sources are saying about Shutterstock Inc's financials and stock price? Try the links below:Shutterstock Inc (SSTK) Stock Price | Nasdaq
Shutterstock Inc (SSTK) Stock Quote, History and News - Yahoo Finance
Shutterstock Inc (SSTK) Stock Price and Basic Information | MarketWatch
Loading social stream, please wait...