Stag Industrial, Inc. (STAG): Price and Financial Metrics


Stag Industrial, Inc. (STAG): $32.67

0.76 (+2.38%)

POWR Rating

Component Grades

Growth

S

Value

I

Momentum

G

Stability

N

Sentiment

U

Quality

P

STAG POWR Grades

  • STAG scores best on the Stability dimension, with a Stability rank ahead of 67.8% of US stocks.
  • STAG's strongest trending metric is Quality; it's been moving up over the last 178 days.
  • STAG ranks lowest in Value; there it ranks in the 14th percentile.

STAG Stock Summary

  • With a one year PEG ratio of 15,627.36, STAG INDUSTRIAL INC is expected to have a higher PEG ratio (a measure of how expensive a stock is relative to its expected earnings growth) than 99.65% of US stocks.
  • Of note is the ratio of STAG INDUSTRIAL INC's sales and general administrative expense to its total operating expenses; merely 5.34% of US stocks have a lower such ratio.
  • For STAG, its debt to operating expenses ratio is greater than that reported by 88.76% of US equities we're observing.
  • Stocks with similar financial metrics, market capitalization, and price volatility to STAG INDUSTRIAL INC are GL, SPFI, ATCX, BFS, and MAYS.
  • STAG's SEC filings can be seen here. And to visit STAG INDUSTRIAL INC's official web site, go to www.stagindustrial.com.

STAG Valuation Summary

  • In comparison to the median Real Estate stock, STAG's price/sales ratio is 100% higher, now standing at 8.6.
  • STAG's price/sales ratio has moved up 1.6 over the prior 145 months.

Below are key valuation metrics over time for STAG.

Stock Date P/S P/B P/E EV/EBIT
STAG 2023-03-10 8.6 1.7 31.6 31.7
STAG 2023-03-09 8.9 1.7 32.8 32.6
STAG 2023-03-08 9.1 1.8 33.7 33.2
STAG 2023-03-07 9.1 1.8 33.5 33.1
STAG 2023-03-06 9.3 1.8 34.4 33.7
STAG 2023-03-03 9.3 1.8 34.4 33.7

STAG Growth Metrics

    Its 2 year net cashflow from operations growth rate is now at 36.91%.
  • Its year over year cash and equivalents growth rate is now at 70.3%.
  • Its 3 year net income to common stockholders growth rate is now at 230.95%.
STAG's revenue has moved up $228,549,000 over the prior 34 months.

The table below shows STAG's growth in key financial areas (numbers in millions of US dollars).

Date Revenue Operating Cash Flow Net Income to Common Stock
2022-12-31 657.345 387.931 178.089
2022-09-30 634.637 379.41 234.576
2022-06-30 610.446 364.969 219.749
2022-03-31 587.373 351.573 220.008
2021-12-31 562.159 336.154 188.175
2021-09-30 544.487 324.404 196.65

STAG's Quality Factors

The “Quality” component of the POWR Ratings focuses on 31 different factors of a companies fundamentals and operational strength. Here are some key insights as we drill into the specifics of these quality attributes.
  • STAG has a Quality Grade of C, ranking ahead of 49.76% of graded US stocks.
  • STAG's asset turnover comes in at 0.112 -- ranking 185th of 444 Trading stocks.
  • MPW, TCI, and EGP are the stocks whose asset turnover ratios are most correlated with STAG.

The table below shows STAG's key quality metrics over time.

Period Asset Turnover Gross Margin ROIC
2021-09-30 0.112 0.807 0.039
2021-06-30 0.112 0.809 0.038
2021-03-31 0.111 0.811 0.037
2020-12-31 0.109 0.815 0.044
2020-09-30 0.108 0.820 0.032
2020-06-30 0.108 0.820 0.030

STAG Stock Price Chart Interactive Chart >

Price chart for STAG

STAG Price/Volume Stats
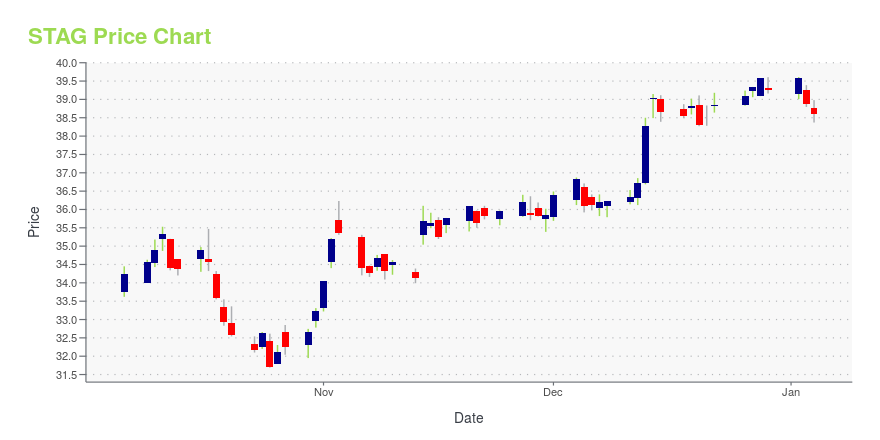
Current price $32.67 52-week high $42.49
Prev. close $31.91 52-week low $26.56
Day low $31.96 Volume 1,087,800
Day high $32.77 Avg. volume 1,068,857
50-day MA $34.42 Dividend yield 4.52%
200-day MA $32.23 Market Cap 5.86B

Stag Industrial, Inc. (STAG) Company Bio


STAG Industrial is focused on the acquisition and operation of single-tenant, industrial properties throughout the United States. The company was founded on July 21, 2010 and is based in Boston, Massachusetts.


STAG Latest News Stream


Event/Time News Detail
Loading, please wait...

STAG Latest Social Stream


Loading social stream, please wait...

View Full STAG Social Stream

Latest STAG News From Around the Web

Below are the latest news stories about STAG INDUSTRIAL INC that investors may wish to consider to help them evaluate STAG as an investment opportunity.

STAG INDUSTRIAL ANNOUNCES STEVE KIMBALL AS EVP--REAL ESTATE OPERATIONS AND BEN BUTCHER'S RETIREMENT AS EXECUTIVE CHAIR

STAG Industrial, Inc. (NYSE: STAG) (the "Company") today announced that its Board of Directors had appointed Steven T. Kimball as Executive Vice President—Real Estate Operations, effective when Mr. Kimball joins the Company this spring.

Yahoo | March 16, 2023

3 Bargain-Basement Dividend Stocks to Buy Right Now

Most stocks trade at lower valuations these days due to the sell-off in the broader market. However, while that's made most stocks cheaper, some really stand out for their bargain-basement prices relative to their rivals.

Yahoo | March 14, 2023

3 Cheap Dividend Stocks to Buy Right Now

Three dividend stocks that are trading at cheap values these days are Simon Property Group (NYSE: SPG), STAG Industrial (NYSE: STAG), and Camden Property Trust (NYSE: CPT). Brent Nyitray (Simon Property Group): Simon Property Group operates high-end shopping malls and premium outlet malls. The real estate investment trust (REIT) also owns an 80% non-controlling interest in Taubman Centers and a stake in French retailer Klepierre.

Yahoo | March 9, 2023

Stag Industrial (STAG) Outpaces Stock Market Gains: What You Should Know

Stag Industrial (STAG) closed the most recent trading day at $33.44, moving +0.42% from the previous trading session.

Yahoo | March 8, 2023

Down 12% to 27%, These Beaten-Down Dividend Stocks Look Like Great Buys This March

Three high-quality dividend stocks that have taken a beating over the past year are Agree Realty (NYSE: ADC), Mid-America Apartment Communities (NYSE: MAA), and Stag Industrial (NYSE: STAG). Shares of Agree Realty have fallen about 12% from their peak over the past year, which has helped push the company's dividend yield up to 4.1%. Meanwhile, the company further padded that yield by also increasing its payout by 7.7% over the past year.

Yahoo | March 5, 2023

Read More 'STAG' Stories Here

STAG Price Returns

1-mo -7.53%
3-mo 1.28%
6-mo 12.40%
1-year -16.55%
3-year 72.26%
5-year 74.31%
YTD 1.83%
2022 -29.65%
2021 59.11%
2020 4.18%
2019 33.19%
2018 -3.82%

STAG Dividends

Ex-Dividend Date Type Payout Amount Change
Loading, please wait...
View Full STAG Dividend History

Continue Researching STAG

Want to see what other sources are saying about STAG Industrial Inc's financials and stock price? Try the links below:

STAG Industrial Inc (STAG) Stock Price | Nasdaq
STAG Industrial Inc (STAG) Stock Quote, History and News - Yahoo Finance
STAG Industrial Inc (STAG) Stock Price and Basic Information | MarketWatch

Get Free Updates

Join thousands of investors who get the latest news, insights and top rated picks from StockNews.com!


Page generated in 0.8674 seconds.