
S&T Bancorp, Inc. (STBA): Price and Financial Metrics
STBA Price/Volume Stats
| Current price | $36.47 | 52-week high | $45.79 |
| Prev. close | $36.19 | 52-week low | $29.85 |
| Day low | $35.61 | Volume | 199,100 |
| Day high | $37.05 | Avg. volume | 179,239 |
| 50-day MA | $37.33 | Dividend yield | 3.81% |
| 200-day MA | $39.69 | Market Cap | 1.40B |
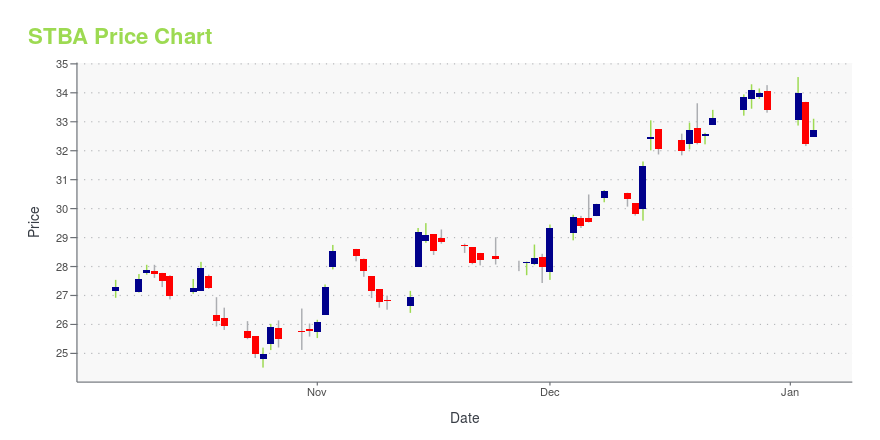
STBA Stock Price Chart Interactive Chart >
S&T Bancorp, Inc. (STBA) Company Bio
S&T Bancorp provides a range of financial services. The company operates in three segments: Community Banking, Insurance, and Wealth Management. The company was founded in 1902 and is based in Indiana, Pennsylvania.
STBA Price Returns
| 1-mo | -2.93% |
| 3-mo | -1.56% |
| 6-mo | -2.05% |
| 1-year | 20.80% |
| 3-year | 40.55% |
| 5-year | 75.46% |
| YTD | -3.75% |
| 2024 | 18.68% |
| 2023 | 2.07% |
| 2022 | 12.61% |
| 2021 | 31.65% |
| 2020 | -35.39% |
STBA Dividends
| Ex-Dividend Date | Type | Payout Amount | Change | ||||||
|---|---|---|---|---|---|---|---|---|---|
| Loading, please wait... | |||||||||
Continue Researching STBA
Want to see what other sources are saying about S&T Bancorp Inc's financials and stock price? Try the links below:S&T Bancorp Inc (STBA) Stock Price | Nasdaq
S&T Bancorp Inc (STBA) Stock Quote, History and News - Yahoo Finance
S&T Bancorp Inc (STBA) Stock Price and Basic Information | MarketWatch
Loading social stream, please wait...