
S&T Bancorp, Inc. (STBA): Price and Financial Metrics
STBA Price/Volume Stats
| Current price | $45.61 | 52-week high | $45.79 |
| Prev. close | $44.83 | 52-week low | $24.51 |
| Day low | $44.47 | Volume | 351,378 |
| Day high | $45.65 | Avg. volume | 168,741 |
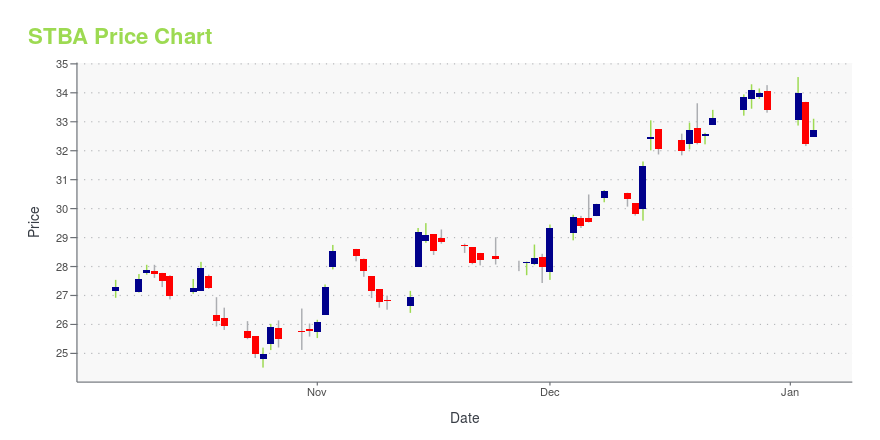
| 50-day MA | $34.00 | Dividend yield | 3.08% |
| 200-day MA | $31.42 | Market Cap | 1.74B |
STBA Stock Price Chart Interactive Chart >
S&T Bancorp, Inc. (STBA) Company Bio
S&T Bancorp provides a range of financial services. The company operates in three segments: Community Banking, Insurance, and Wealth Management. The company was founded in 1902 and is based in Indiana, Pennsylvania.
Latest STBA News From Around the Web
Below are the latest news stories about S&T BANCORP INC that investors may wish to consider to help them evaluate STBA as an investment opportunity.
Here's Why We Think S&T Bancorp (NASDAQ:STBA) Is Well Worth WatchingFor beginners, it can seem like a good idea (and an exciting prospect) to buy a company that tells a good story to... |
S&T Bancorp (STBA) Soars 5.6%: Is Further Upside Left in the Stock?S&T Bancorp (STBA) witnessed a jump in share price last session on above-average trading volume. The latest trend in earnings estimate revisions for the stock doesn't suggest further strength down the road. |
S&T Bancorp (NASDAQ:STBA) investors are sitting on a loss of 12% if they invested five years agoThe main aim of stock picking is to find the market-beating stocks. But the main game is to find enough winners to more... |
There's A Lot To Like About S&T Bancorp's (NASDAQ:STBA) Upcoming US$0.33 DividendIt looks like S&T Bancorp, Inc. ( NASDAQ:STBA ) is about to go ex-dividend in the next four days. The ex-dividend date... |
S&T Bancorp's (NASDAQ:STBA) Upcoming Dividend Will Be Larger Than Last Year'sS&T Bancorp, Inc. ( NASDAQ:STBA ) has announced that it will be increasing its dividend from last year's comparable... |
STBA Price Returns
| 1-mo | 41.56% |
| 3-mo | 48.77% |
| 6-mo | 33.39% |
| 1-year | 49.47% |
| 3-year | 73.88% |
| 5-year | 45.76% |
| YTD | 39.37% |
| 2023 | 2.07% |
| 2022 | 12.61% |
| 2021 | 31.65% |
| 2020 | -35.39% |
| 2019 | 9.48% |
STBA Dividends
| Ex-Dividend Date | Type | Payout Amount | Change | ||||||
|---|---|---|---|---|---|---|---|---|---|
| Loading, please wait... | |||||||||
Continue Researching STBA
Want to see what other sources are saying about S&T Bancorp Inc's financials and stock price? Try the links below:S&T Bancorp Inc (STBA) Stock Price | Nasdaq
S&T Bancorp Inc (STBA) Stock Quote, History and News - Yahoo Finance
S&T Bancorp Inc (STBA) Stock Price and Basic Information | MarketWatch
Loading social stream, please wait...