
Synchrony Financial (SYF): Price and Financial Metrics
SYF Price/Volume Stats
| Current price | $47.51 | 52-week high | $70.93 |
| Prev. close | $46.96 | 52-week low | $39.67 |
| Day low | $46.89 | Volume | 3,860,000 |
| Day high | $48.46 | Avg. volume | 4,632,375 |
| 50-day MA | $56.23 | Dividend yield | 2.17% |
| 200-day MA | $56.48 | Market Cap | 18.47B |
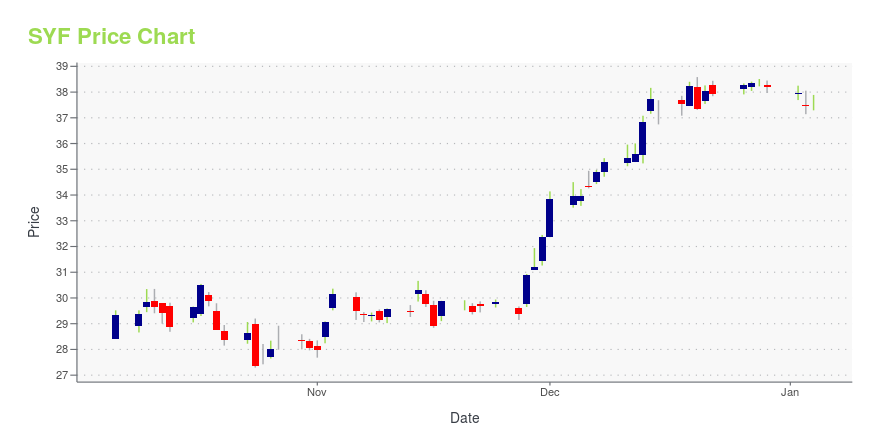
SYF Stock Price Chart Interactive Chart >
Synchrony Financial (SYF) Company Bio
Synchrony Financial is a consumer financial services company headquartered in Stamford, Connecticut, United States. The company offers consumer financing products, including credit, promotional financing and loyalty programs, installment lending to industries, and FDIC-insured consumer savings products through Synchrony Bank, its wholly owned online bank subsidiary. (Source:Wikipedia)
SYF Price Returns
| 1-mo | -11.10% |
| 3-mo | -29.68% |
| 6-mo | -15.10% |
| 1-year | 21.33% |
| 3-year | N/A |
| 5-year | 246.32% |
| YTD | -26.64% |
| 2024 | 74.01% |
| 2023 | 19.76% |
| 2022 | -27.43% |
| 2021 | 36.40% |
| 2020 | -0.08% |
SYF Dividends
| Ex-Dividend Date | Type | Payout Amount | Change | ||||||
|---|---|---|---|---|---|---|---|---|---|
| Loading, please wait... | |||||||||
Continue Researching SYF
Want to see what other sources are saying about Synchrony Financial's financials and stock price? Try the links below:Synchrony Financial (SYF) Stock Price | Nasdaq
Synchrony Financial (SYF) Stock Quote, History and News - Yahoo Finance
Synchrony Financial (SYF) Stock Price and Basic Information | MarketWatch
Loading social stream, please wait...