Synchrony Financial (SYF): Price and Financial Metrics
GET POWR RATINGS... FREE!
SYF POWR Grades
- Quality is the dimension where SYF ranks best; there it ranks ahead of 87.06% of US stocks.
- The strongest trend for SYF is in Quality, which has been heading down over the past 177 days.
- SYF ranks lowest in Sentiment; there it ranks in the 19th percentile.
SYF Stock Summary
- SYF's current price/earnings ratio is 4.12, which is higher than just 8.11% of US stocks with positive earnings.
- The price/operating cash flow metric for SYNCHRONY FINANCIAL is higher than just 8.32% of stocks in our set with a positive cash flow.
- Shareholder yield, a measure of how much is returned to shareholders via dividends and share repurchases, for SYF comes in at 33.32% -- higher than that of 94.44% of stocks in our set.
- Stocks with similar financial metrics, market capitalization, and price volatility to SYNCHRONY FINANCIAL are UNM, ALLY, UHS, AFG, and FCNCA.
- SYF's SEC filings can be seen here. And to visit SYNCHRONY FINANCIAL's official web site, go to www.synchrony.com.
SYF Valuation Summary
- SYF's price/earnings ratio is 4.2; this is 55.79% lower than that of the median Financial Services stock.
- Over the past 105 months, SYF's price/sales ratio has gone down 1.6.
Below are key valuation metrics over time for SYF.
Stock | Date | P/S | P/B | P/E | EV/EBIT |
---|---|---|---|---|---|
SYF | 2023-03-17 | 1.5 | 1.0 | 4.2 | 4.2 |
SYF | 2023-03-16 | 1.5 | 1.0 | 4.3 | 4.2 |
SYF | 2023-03-15 | 1.5 | 1.0 | 4.2 | 4.2 |
SYF | 2023-03-14 | 1.6 | 1.0 | 4.5 | 4.4 |
SYF | 2023-03-13 | 1.5 | 1.0 | 4.3 | 4.3 |
SYF | 2023-03-10 | 1.7 | 1.1 | 4.7 | 4.6 |
SYF Growth Metrics
- The year over year price growth rate now stands at -2.28%.
- Its 5 year net cashflow from operations growth rate is now at 16.47%.
- Its 3 year net income to common stockholders growth rate is now at 25.48%.

The table below shows SYF's growth in key financial areas (numbers in millions of US dollars).
Date | Revenue | Operating Cash Flow | Net Income to Common Stock |
---|---|---|---|
2022-12-31 | 8,299 | 6,694 | 2,974 |
2022-09-30 | 8,576 | 6,851 | 3,210 |
2022-06-30 | 9,051 | 7,032 | 3,648 |
2022-03-31 | 9,491 | 6,656 | 4,087 |
2021-12-31 | 9,466 | 7,099 | 4,179 |
2021-09-30 | 9,241 | 7,181 | 4,104 |
SYF's Quality Factors
The “Quality” component of the POWR Ratings focuses on 31 different factors of a companies fundamentals and operational strength. Here are some key insights as we drill into the specifics of these quality attributes.- SYF has a Quality Grade of B, ranking ahead of 90.42% of graded US stocks.
- SYF's asset turnover comes in at 0.098 -- ranking 48th of 428 Banking stocks.
- AXP, COF, and MRLN are the stocks whose asset turnover ratios are most correlated with SYF.
The table below shows SYF's key quality metrics over time.
Period | Asset Turnover | Gross Margin | ROIC |
---|---|---|---|
2021-09-30 | 0.098 | 1 | 0.057 |
2021-06-30 | 0.087 | 1 | 0.045 |
2021-03-31 | 0.070 | 1 | 0.028 |
2020-12-31 | 0.061 | 1 | 0.018 |
2020-09-30 | 0.060 | 1 | 0.017 |
2020-06-30 | 0.068 | 1 | 0.026 |
SYF Price Target
For more insight on analysts targets of SYF, see our SYF price target page. And for a list of of all stocks sorted by upside potential based on analyst target price, see our Top Price Target page.
Average Price Target | $57.21 | Average Broker Recommendation | 1.52 (Moderate Buy) |
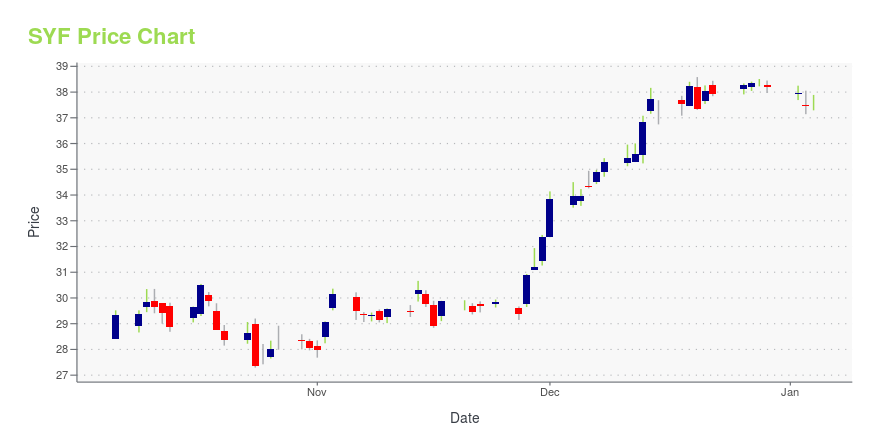
SYF Stock Price Chart Interactive Chart >
SYF Price/Volume Stats
Current price | $28.65 | 52-week high | $41.88 |
Prev. close | $28.16 | 52-week low | $27.15 |
Day low | $28.37 | Volume | 4,734,800 |
Day high | $28.83 | Avg. volume | 5,851,702 |
50-day MA | $33.89 | Dividend yield | 3.25% |
200-day MA | $33.13 | Market Cap | 12.52B |
Synchrony Financial (SYF) Company Bio
Synchrony Financial is a consumer financial services company headquartered in Stamford, Connecticut, United States. The company offers consumer financing products, including credit, promotional financing and loyalty programs, installment lending to industries, and FDIC-insured consumer savings products through Synchrony Bank, its wholly owned online bank subsidiary. (Source:Wikipedia)
Latest SYF News From Around the Web
Below are the latest news stories about SYNCHRONY FINANCIAL that investors may wish to consider to help them evaluate SYF as an investment opportunity.
Synchrony to Announce First Quarter 2023 Financial Results on April 19, 2023Synchrony (NYSE: SYF) plans to report its first quarter 2023 results on Wednesday, April 19, 2023. The earnings release and presentation materials are scheduled to be released and posted to the Investor Relations section of the Company's website, www.investors.synchronyfinancial.com, at approximately 6:00 a.m. Eastern Time. A conference call to discuss Synchrony's results will be held at 8:00 a.m. Eastern Time on that day; the live audio webcast and replay can be accessed through the same websit |
Synchrony Study Reveals Future Shoppers Seek Connected, Curated and Convenient Shopping ExperiencesSynchrony (NYSE: SYF), a premier consumer financial services company, today announced that its new Future of Shopping study reveals that consumers seek highly personalized experiences that simplify choice and flexibility, where more than 80 percent of shoppers will expect experiences curated just for them by 2030. The research determined that retailers who prioritize an experience-driven shopping strategy will prevail if they continue to innovate and differentiate themselves with new technologie |
Axos Financial (AX) Soars 6.7%: Is Further Upside Left in the Stock?Axos Financial (AX) saw its shares surge in the last session with trading volume being higher than average. The latest trend in earnings estimate revisions may not translate into further price increase in the near term. |
Synchrony Financial’s February loan delinquencies, net charge-offs rise from last month and from a year agoSynchrony Financial (SYF) disclosed Wednesday that over-30 day loan delinquencies and and net charge-offs, or debt owed that was written off, as a percentage of loan receivables for February rose from January and from a year ago, which the consumer financial services company said just reflected the “normalization of credit trends.” The company said loan delinquencies was at 3.9% in February, compared with 3.8% in January and 2.9% a year ago. Net charge-offs were 4.7% in February, up from 4.2% in January and from 2.8% a year ago. |
Why Bank Stocks Ranging From Ally Financial to U.S. Bank Are Crashing (Again) TodayThe failure of Silicon Valley Bank is sparking concerns that its woes may be more common than had been previously believed. |
SYF Price Returns
1-mo | -19.77% |
3-mo | -12.28% |
6-mo | 2.91% |
1-year | -17.76% |
3-year | 85.09% |
5-year | -2.57% |
YTD | -12.28% |
2022 | -27.43% |
2021 | 36.40% |
2020 | -0.08% |
2019 | 57.48% |
2018 | -37.84% |
SYF Dividends
Ex-Dividend Date | Type | Payout Amount | Change | ||||||
---|---|---|---|---|---|---|---|---|---|
Loading, please wait... |
Continue Researching SYF
Want to see what other sources are saying about Synchrony Financial's financials and stock price? Try the links below:Synchrony Financial (SYF) Stock Price | Nasdaq
Synchrony Financial (SYF) Stock Quote, History and News - Yahoo Finance
Synchrony Financial (SYF) Stock Price and Basic Information | MarketWatch
Loading social stream, please wait...