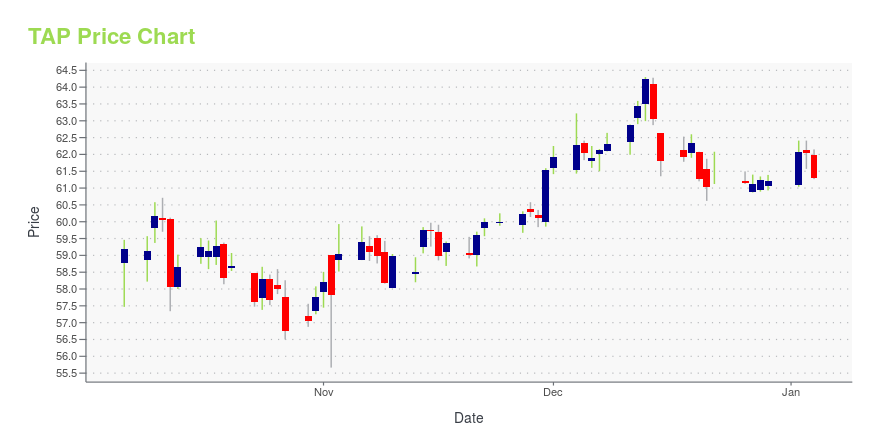
Molson Coors Beverage Co. Cl B (TAP): Price and Financial Metrics
GET POWR RATINGS... FREE!
TAP POWR Grades
- TAP scores best on the Value dimension, with a Value rank ahead of 83.41% of US stocks.
- TAP's strongest trending metric is Momentum; it's been moving up over the last 179 days.
- TAP ranks lowest in Sentiment; there it ranks in the 9th percentile.
TAP Stock Summary
- TAP's went public 36.27 years ago, making it older than 92.84% of listed US stocks we're tracking.
- In terms of twelve month growth in earnings before interest and taxes, Molson Coors Beverage Co is reporting a growth rate of -501.64%; that's higher than merely 4.06% of US stocks.
- In terms of volatility of its share price, TAP is more volatile than only 14.62% of stocks we're observing.
- Stocks with similar financial metrics, market capitalization, and price volatility to Molson Coors Beverage Co are APG, AVNT, LAD, MHK, and WCC.
- TAP's SEC filings can be seen here. And to visit Molson Coors Beverage Co's official web site, go to www.molsoncoors.com.
TAP Valuation Summary
- TAP's price/earnings ratio is -17.2; this is 175.94% lower than that of the median Consumer Defensive stock.
- TAP's price/earnings ratio has moved down 32.5 over the prior 243 months.
- Over the past 243 months, TAP's price/sales ratio has gone up 0.3.
Below are key valuation metrics over time for TAP.
Stock | Date | P/S | P/B | P/E | EV/EBIT |
---|---|---|---|---|---|
TAP | 2021-09-03 | 1 | 0.7 | -17.2 | 512.8 |
TAP | 2021-09-02 | 1 | 0.7 | -17.3 | 513.5 |
TAP | 2021-09-01 | 1 | 0.7 | -17.3 | 514.6 |
TAP | 2021-08-31 | 1 | 0.7 | -17.4 | 516.3 |
TAP | 2021-08-30 | 1 | 0.7 | -17.1 | 511.3 |
TAP | 2021-08-27 | 1 | 0.7 | -17.4 | 516.2 |
TAP Growth Metrics
- Its 2 year price growth rate is now at -32.37%.
- The 2 year revenue growth rate now stands at -4.65%.
- Its 2 year net income to common stockholders growth rate is now at -101.79%.

The table below shows TAP's growth in key financial areas (numbers in millions of US dollars).
Date | Revenue | Operating Cash Flow | Net Income to Common Stock |
---|---|---|---|
2021-12-31 | 10,279.7 | 1,573.5 | 1,005.7 |
2021-09-30 | 9,954.8 | 1,470.2 | -444.1 |
2021-06-30 | 9,885.6 | 1,384.3 | -554.3 |
2021-03-31 | 9,449.6 | 1,522.9 | -747.9 |
2020-12-31 | 9,654 | 1,695.7 | -949 |
2020-09-30 | 9,845.9 | 2,102.3 | 584.5 |
TAP's Quality Factors
The “Quality” component of the POWR Ratings focuses on 31 different factors of a companies fundamentals and operational strength. Here are some key insights as we drill into the specifics of these quality attributes.- TAP has a Quality Grade of C, ranking ahead of 56.56% of graded US stocks.
- TAP's asset turnover comes in at 0.36 -- ranking 11th of 16 Beer & Liquor stocks.
- EAST, WVVI, and NBEV are the stocks whose asset turnover ratios are most correlated with TAP.
The table below shows TAP's key quality metrics over time.
Period | Asset Turnover | Gross Margin | ROIC |
---|---|---|---|
2021-09-30 | 0.360 | 0.411 | 0.005 |
2021-06-30 | 0.354 | 0.415 | 0.003 |
2021-03-31 | 0.338 | 0.410 | -0.008 |
2020-12-31 | 0.341 | 0.390 | -0.032 |
2020-09-30 | 0.344 | 0.390 | 0.099 |
2020-06-30 | 0.346 | 0.382 | 0.033 |
TAP Price Target
For more insight on analysts targets of TAP, see our TAP price target page. And for a list of of all stocks sorted by upside potential based on analyst target price, see our Top Price Target page.
Average Price Target | $57.44 | Average Broker Recommendation | 1.83 (Hold) |
TAP Stock Price Chart Interactive Chart >
TAP Price/Volume Stats
Current price | $55.62 | 52-week high | $57.75 |
Prev. close | $54.51 | 52-week low | $42.46 |
Day low | $54.20 | Volume | 1,182,400 |
Day high | $55.76 | Avg. volume | 1,606,604 |
50-day MA | $53.84 | Dividend yield | 2.73% |
200-day MA | $49.78 | Market Cap | 12.06B |
Molson Coors Beverage Co. Cl B (TAP) Company Bio
Molson Coors Beverage Co. is a holding company, which engages in the provision of beer. It operates through the following segments: United States, Canada, Europe, International, and Corporate. The United States segment consists of production, marketing and sales of its brands, and other owned and licensed brands in the United States. The Canada segment includes production, marketing and sales of its brands, and other owned and licensed brands in Canada. The Europe segment comprises of production, marketing and sales of its brands as well as a number of regional brands in the United Kingdom, Republic of Ireland, and Central Europe. The International segment focuses its operations on Latin America, Europe, Asia Pacific, and Africa. The Corporate segment represents interest and certain other general and administrative costs that are not allocated to any of the operating segments. It operates under the brands Blue Moon, Coors Banquet, Coors Light, Miller Genuine Draft, Miller Lite, taropramen, Carling, Molson Canadian, Creemore Springs, Cobra, Doom Bar, Henry's Hard and Leinenkugel's. The company was founded in 1786 and is headquartered in Denver, CO.
Latest TAP News From Around the Web
Below are the latest news stories about Molson Coors Beverage Co that investors may wish to consider to help them evaluate TAP as an investment opportunity.
Molson Coors Delivers Double-Digit 4th-Quarter GrowthManagement is delivering on revitalization plan |
Molson Coors Beverage's (TAP) CEO Gavin Hattersley on Q4 2021 Results - Earnings Call TranscriptMolson Coors Beverage Company (TAP) Q4 2021 Earnings Conference Call February 23, 2022 11:00 AM ET Company Participants Greg Tierney – Vice President of FP&A and Investor Relations Gavin Hattersley – President and Chief Executive Officer Tracey Joubert – Chief Financial Officer Conference Call Participants Kevin Grundy – Jefferies Rob... |
Molson Coors raises dividend amid higher sales as venues reopen, restrictions easeMONTREAL - Molson Coors Beverage Co. has raised it dividend amid higher sales and profits in its latest quarter as the company benefited from the reop |
Molson Coors Beverage Clocks 14% Sales Growth In Q4, Tops Consensus; Boosts Dividend By 12%Molson Coors Beverage Co (NYSE: TAP ) reported fourth-quarter FY21 sales growth of 14.2% year-on-year, to $2.62 billion, beating the consensus of $2.55 billion. Net sales in the Americas rose 7.6% Y/Y, and EMEA & APAC gained 56.4%. Gross profit fell 4.2% Y/Y to $857.3 million. The operating margin was 6.3%, and Full story available on Benzinga.com |
Molson Coors beats on revenue, misses on profitMolson Coors Beverage Co. reported fourth quarter net income of $80.0 million, or 37 cents per share, after a loss of $1.37 billion, or $6.32 per share, last year. Adjusted EPS of 81 cents missed the FactSet consensus for 86 cents. Sales of $3.194 billion were up from $2.778 billion and well ahead of the FactSet consensus for $2.547 billion. Revenue grew at Coors Light and Miller Lite, two of the company''s biggest brands. "This year, we grew the top-line for the first time in a decade," said Chief Executive Gavin Hattersley in a statement. The company has renamed its reporting segments with North America now Americas, and Europe now EMEA & APAC. Both saw sales increases during the quarter with EMEA & APAC up 56.4%. Molson Coors stock slipped 0.5% in Wednesday premarket trading, and is ... |
TAP Price Returns
1-mo | 3.04% |
3-mo | 6.85% |
6-mo | 19.17% |
1-year | 6.45% |
3-year | 4.22% |
5-year | -28.02% |
YTD | 21.74% |
2021 | 4.12% |
2020 | -15.20% |
2019 | -0.44% |
2018 | -29.88% |
2017 | -14.11% |
TAP Dividends
Ex-Dividend Date | Type | Payout Amount | Change | ||||||
---|---|---|---|---|---|---|---|---|---|
Loading, please wait... |
Continue Researching TAP
Want to see what other sources are saying about Molson Coors Beverage Co's financials and stock price? Try the links below:Molson Coors Beverage Co (TAP) Stock Price | Nasdaq
Molson Coors Beverage Co (TAP) Stock Quote, History and News - Yahoo Finance
Molson Coors Beverage Co (TAP) Stock Price and Basic Information | MarketWatch
Loading social stream, please wait...