TE Connectivity Ltd. (TEL): Price and Financial Metrics
GET POWR RATINGS... FREE!
TEL POWR Grades
- Sentiment is the dimension where TEL ranks best; there it ranks ahead of 86.89% of US stocks.
- The strongest trend for TEL is in Growth, which has been heading down over the past 179 days.
- TEL's current lowest rank is in the Growth metric (where it is better than 26.55% of US stocks).
TEL Stock Summary
- With a market capitalization of $44,577,759,807, TE Connectivity Ltd has a greater market value than 93.88% of US stocks.
- TEL's one year PEG ratio, measuring expected growth in earnings next year relative to current common stock price is 4.84 -- higher than just 20.9% of US-listed equities with positive expected earnings growth.
- Over the past twelve months, TEL has reported earnings growth of 376.29%, putting it ahead of 94.21% of US stocks in our set.
- If you're looking for stocks that are quantitatively similar to TE Connectivity Ltd, a group of peers worth examining would be ZBRA, ENTG, RMD, A, and GLW.
- TEL's SEC filings can be seen here. And to visit TE Connectivity Ltd's official web site, go to www.te.com.
TEL Valuation Summary
- TEL's price/earnings ratio is 29.1; this is 25.38% lower than that of the median Technology stock.
- Over the past 173 months, TEL's EV/EBIT ratio has gone up 9.5.
- TEL's price/sales ratio has moved up 2 over the prior 173 months.
Below are key valuation metrics over time for TEL.
Stock | Date | P/S | P/B | P/E | EV/EBIT |
---|---|---|---|---|---|
TEL | 2021-09-01 | 3.4 | 4.9 | 29.1 | 24.2 |
TEL | 2021-08-31 | 3.4 | 4.9 | 29.0 | 24.2 |
TEL | 2021-08-30 | 3.5 | 5.0 | 29.5 | 24.6 |
TEL | 2021-08-27 | 3.5 | 5.0 | 29.5 | 24.6 |
TEL | 2021-08-26 | 3.4 | 4.9 | 29.2 | 24.3 |
TEL | 2021-08-25 | 3.4 | 4.9 | 29.1 | 24.3 |
TEL Growth Metrics
- Its 5 year net income to common stockholders growth rate is now at -66.43%.
- Its year over year revenue growth rate is now at 0.13%.
- The 4 year net income to common stockholders growth rate now stands at -66.43%.

The table below shows TEL's growth in key financial areas (numbers in millions of US dollars).
Date | Revenue | Operating Cash Flow | Net Income to Common Stock |
---|---|---|---|
2021-12-31 | 15,219 | 2,568 | 2,446 |
2021-09-30 | 14,923 | 2,676 | 2,261 |
2021-06-30 | 14,366 | 2,622 | 1,697 |
2021-03-31 | 13,069 | 2,320 | 1,076 |
2020-12-31 | 12,526 | 2,221 | 114 |
2020-09-30 | 12,172 | 1,992 | -241 |
TEL's Quality Factors
The “Quality” component of the POWR Ratings focuses on 31 different factors of a companies fundamentals and operational strength. Here are some key insights as we drill into the specifics of these quality attributes.- TEL has a Quality Grade of C, ranking ahead of 61.94% of graded US stocks.
- TEL's asset turnover comes in at 0.705 -- ranking 90th of 105 Wholesale stocks.
- LKQ, UNVR, and SCHN are the stocks whose asset turnover ratios are most correlated with TEL.
The table below shows TEL's key quality metrics over time.
Period | Asset Turnover | Gross Margin | ROIC |
---|---|---|---|
2021-06-25 | 0.705 | 0.320 | 0.178 |
2021-03-26 | 0.659 | 0.309 | 0.132 |
2020-12-25 | 0.645 | 0.307 | 0.046 |
2020-09-25 | 0.629 | 0.307 | 0.049 |
2020-06-26 | 0.627 | 0.313 | 0.057 |
2020-03-27 | 0.663 | 0.323 | 0.087 |
TEL Price Target
For more insight on analysts targets of TEL, see our TEL price target page. And for a list of of all stocks sorted by upside potential based on analyst target price, see our Top Price Target page.
Average Price Target | $156.71 | Average Broker Recommendation | 1.56 (Moderate Buy) |
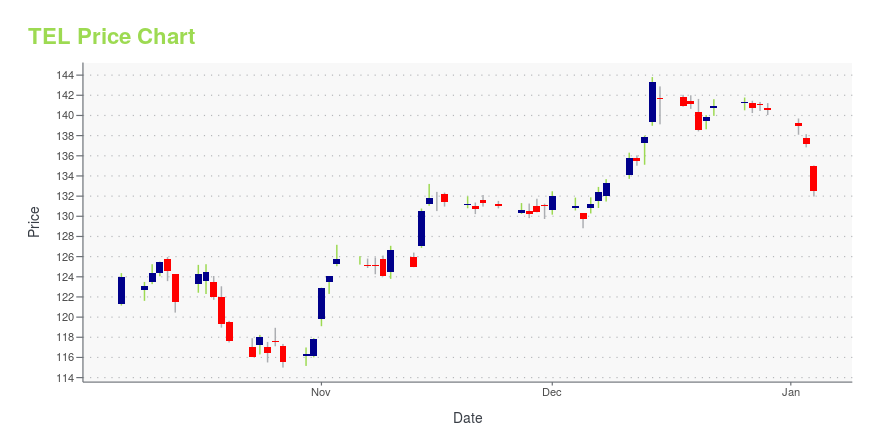
TEL Stock Price Chart Interactive Chart >
TEL Price/Volume Stats
Current price | $122.68 | 52-week high | $166.44 |
Prev. close | $122.68 | 52-week low | $119.58 |
Day low | $119.58 | Volume | 1,981,600 |
Day high | $124.35 | Avg. volume | 1,807,874 |
50-day MA | $126.97 | Dividend yield | 1.83% |
200-day MA | $144.40 | Market Cap | 39.52B |
TE Connectivity Ltd. (TEL) Company Bio
TE Connectivity is an American Swiss-domiciled technology company that designs and manufactures connectors and sensors for several industries, such as automotive, industrial equipment, data communication systems, aerospace, defense, medical, oil and gas, consumer electronics and energy. (Source:Wikipedia)
Latest TEL News From Around the Web
Below are the latest news stories about TE Connectivity Ltd that investors may wish to consider to help them evaluate TEL as an investment opportunity.
Why Is TE Connectivity (TEL) Up 3% Since Last Earnings Report?TE Connectivity (TEL) reported earnings 30 days ago. What's next for the stock? We take a look at earnings estimates for some clues. |
TE Connectivity ranks among Clarivate Top 100 Global Innovators for 11th yearTE Connectivity (NYSE: TEL), a world leader in connectivity and sensors, has been recognized for the 11th straight year by Clarivate as one of the Top 100 Global Innovators 2022, demonstrating TE's consistent ability to bring new technology to the markets it serves, even amid recent global business challenges. |
Electric Vehicle Wiring Harness Market 2022 by Size, Types, Applications, Manufacturers: Know Experts Detailed Analysis on Global Market by 2028Pune, Feb. 21, 2022 (GLOBE NEWSWIRE) -- Global Electric Vehicle Wiring Harness Market report delivers a complete overview of key components like drivers, limitations, historic and current trends, technical development, and future growth. Research report contains company analysis, size, share, revenue and sales of the company, current advancements. Electric Vehicle Wiring Harness market analysis also focuses on the global key top industry players in the market, with details such as company profiles, capacity, production, price, cost, revenue. Get a Sample Copy of the Report at - https://www.absolutereports.com/enquiry/request-sample/20229060 The top players are concentrating mostly on technical developments in order to increase efficiency. The long-term growth patterns for this market ca... |
LFUS vs. TEL: Which Stock Is the Better Value Option?LFUS vs. TEL: Which Stock Is the Better Value Option? |
Crawford Investment Counsel Inc Buys Healthcare Services Group Inc, Wells Fargo, TE ...Atlanta, GA, based Investment company Crawford Investment Counsel Inc (Current Portfolio) buys Healthcare Services Group Inc, Wells Fargo, TE Connectivity, Hasbro Inc, AT&T Inc, sells Fidelity National Information Services Inc, , Compass Minerals International Inc, Kyndryl Holdings Inc, Moody's Corporation during the 3-months ended 2021Q4, according to the most recent filings of the investment company, Crawford Investment Counsel Inc. |
TEL Price Returns
1-mo | 0.30% |
3-mo | N/A |
6-mo | -23.07% |
1-year | -6.35% |
3-year | 49.07% |
5-year | 77.90% |
YTD | -23.36% |
2021 | 35.12% |
2020 | 28.95% |
2019 | 29.37% |
2018 | -18.87% |
2017 | 39.88% |
TEL Dividends
Ex-Dividend Date | Type | Payout Amount | Change | ||||||
---|---|---|---|---|---|---|---|---|---|
Loading, please wait... |
Continue Researching TEL
Want to see what other sources are saying about TE Connectivity Ltd's financials and stock price? Try the links below:TE Connectivity Ltd (TEL) Stock Price | Nasdaq
TE Connectivity Ltd (TEL) Stock Quote, History and News - Yahoo Finance
TE Connectivity Ltd (TEL) Stock Price and Basic Information | MarketWatch
Loading social stream, please wait...