
Terex Corporation (TEX): Price and Financial Metrics
TEX Price/Volume Stats
| Current price | $66.76 | 52-week high | $68.08 |
| Prev. close | $65.69 | 52-week low | $43.70 |
| Day low | $66.46 | Volume | 1,437,480 |
| Day high | $68.08 | Avg. volume | 819,958 |
| 50-day MA | $57.31 | Dividend yield | 1.03% |
| 200-day MA | $56.71 | Market Cap | 4.49B |
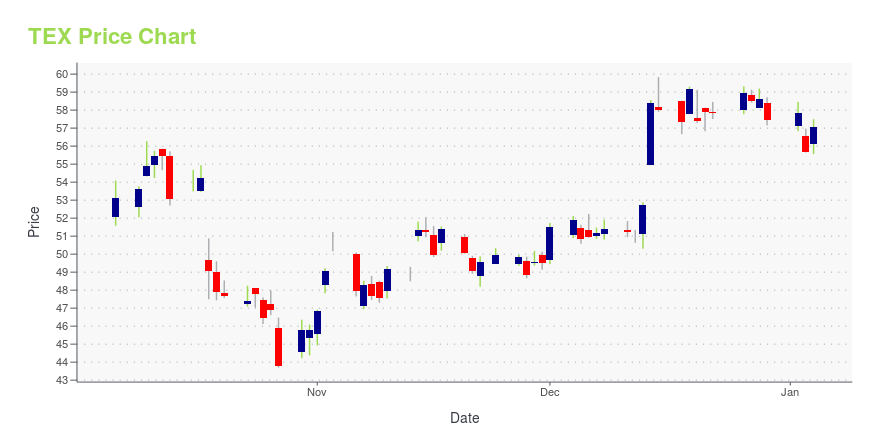
TEX Stock Price Chart Interactive Chart >
Terex Corporation (TEX) Company Bio
Terex Corporation is a lifting and material handling solutions company reporting in five business segments: Aerial Work Platforms, Construction, Cranes, Material Handling & Port Solutions and Materials Processing. Terex manufactures a broad range of equipment for use in various industries, including the construction, infrastructure, manufacturing, shipping, transportation, refining, energy, utility, quarrying and mining industries. The company was founded in 1925 and is based in Westport, Connecticut.
Latest TEX News From Around the Web
Below are the latest news stories about TEREX CORP that investors may wish to consider to help them evaluate TEX as an investment opportunity.
Terex (TEX) Gains 40% in a Year: Will the Rally Last in 2024?Terex (TEX) is expected to maintain its momentum backed by backlog strength, focus on the Execute, Innovate, Grow strategy and the introduction of innovative products. |
Terex Corporation's (NYSE:TEX) Stock Is Going Strong: Is the Market Following Fundamentals?Terex's (NYSE:TEX) stock is up by a considerable 16% over the past month. Since the market usually pay for a company’s... |
Terex Corp Chairman and CEO John L. Garrison Jr. Sells 45,000 SharesJohn L. Garrison Jr., Chairman and CEO of Terex Corp (NYSE:TEX), executed a sale of 45,000 shares in the company on December 19, 2023, according to a recent SEC filing. |
Terex (TEX) Ascends But Remains Behind Market: Some Facts to NoteTerex (TEX) closed at $57.88 in the latest trading session, marking a +0.87% move from the prior day. |
Terex Stock Trading Near High; On 'Most Responsible' Companies ListIf the numbers for construction and mining equipment maker Terex are any indication, the economy is doing all right. The construction, infrastructure, mining and shipping/transportation industries all rely on companies like Terex to provide the equipment they need to get the job done. Terex has reported earnings growth ranging from 46% to 120% over the past four quarters. |
TEX Price Returns
| 1-mo | 25.44% |
| 3-mo | 12.36% |
| 6-mo | 9.20% |
| 1-year | 19.07% |
| 3-year | 48.83% |
| 5-year | 113.66% |
| YTD | 16.88% |
| 2023 | 36.10% |
| 2022 | -1.44% |
| 2021 | 27.22% |
| 2020 | 17.82% |
| 2019 | 9.67% |
TEX Dividends
| Ex-Dividend Date | Type | Payout Amount | Change | ||||||
|---|---|---|---|---|---|---|---|---|---|
| Loading, please wait... | |||||||||
Continue Researching TEX
Want to do more research on Terex Corp's stock and its price? Try the links below:Terex Corp (TEX) Stock Price | Nasdaq
Terex Corp (TEX) Stock Quote, History and News - Yahoo Finance
Terex Corp (TEX) Stock Price and Basic Information | MarketWatch
Loading social stream, please wait...